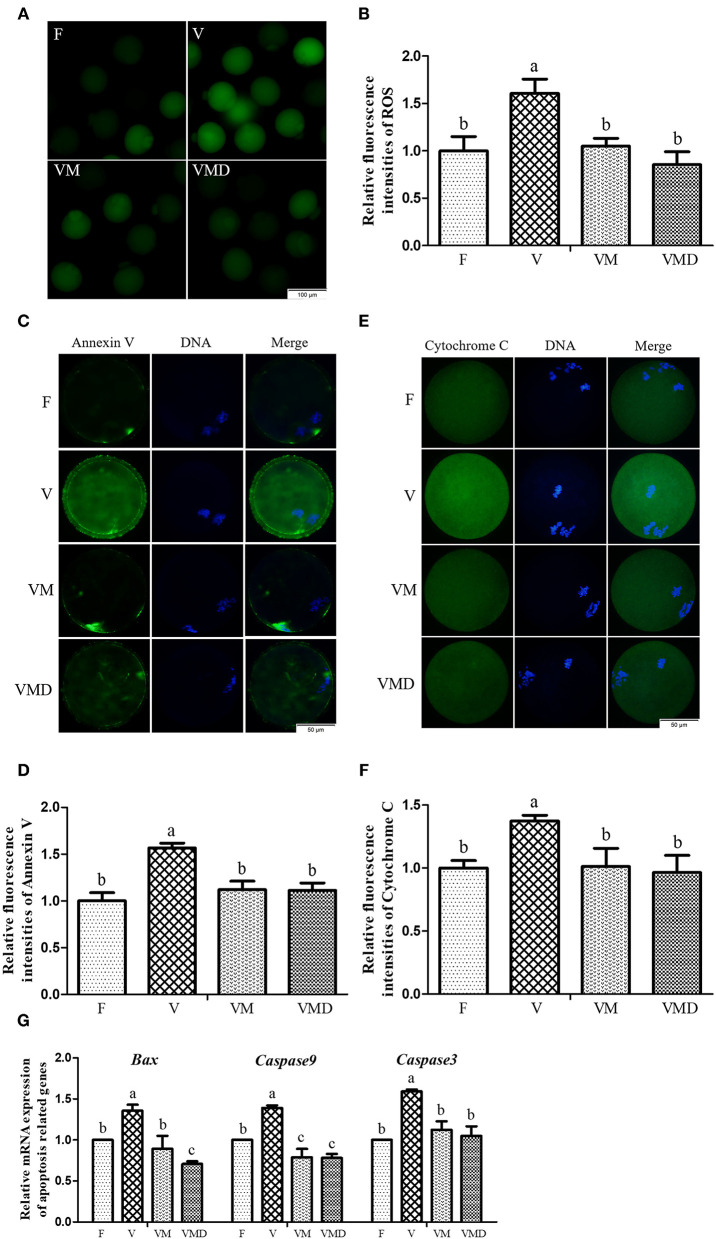
Figure 5.
Effects of melatonin on oxidative stress and apoptosis in MII oocytes derived from vitrified-warmed mouse GV oocytes. (A) Representative images of oocytes staining with DCHFDA. Scale bar, 100 μm. (B) The fluorescence intensity of ROS levels was recorded using ImageJ software. In total, n = 150 MII oocytes were used in this assay (F: n = 32; V: n = 41; VM: n = 42; VMD: n = 35). (C) Representative images of oocytes staining with Annexin V. Scale bar, 50 μm. (D) The fluorescence intensity of Annexin V was recorded using ImageJ software. In total, n = 145 MII oocytes were used in this assay (F: n = 41; V: n = 37; VM: n = 36; VMD: n = 31). (E) Representative images of Cytochrome C in mouse MII oocytes. Scale bar, 50 μm. (F) The fluorescence intensity of Cytochrome C was recorded using ImageJ software. In total, n = 172 MII oocytes were used in this assay (F: n = 40; V: n = 39; VM: n = 46; VMD: n = 47). (G) The expression levels of pro-apoptosis related genes. Data are presented as mean ± SEM of three independent experiments. Groups without a common superscript are significantly different (P < 0.05).The four experimental groups: Fresh control (F), vitrification (V), vitrification + MT (VM), and vitrification + Mdivi-1 (VMD).

