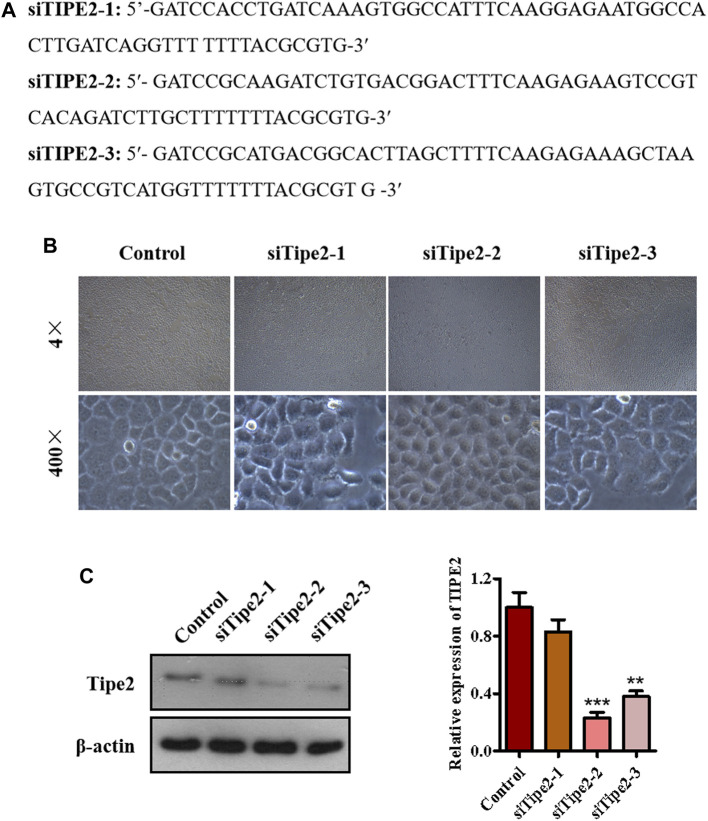
FIGURE 3.
The establishment of TIPE2-silence cell line BGC823/TIPE2−/−. (A) The sequence of siTIPE2 RNA. (B) The effect of siTIPE2 RNA on BGC-823 cells. (C) The effect of siTIPE2 RNA on TIPE2 expression. The values of the histogram are displayed as mean ± SD, 0.001 < p < 0.01 (**) represented for very significant difference and p < 0.001 (***) represents an extremely significant difference to the normal control.

