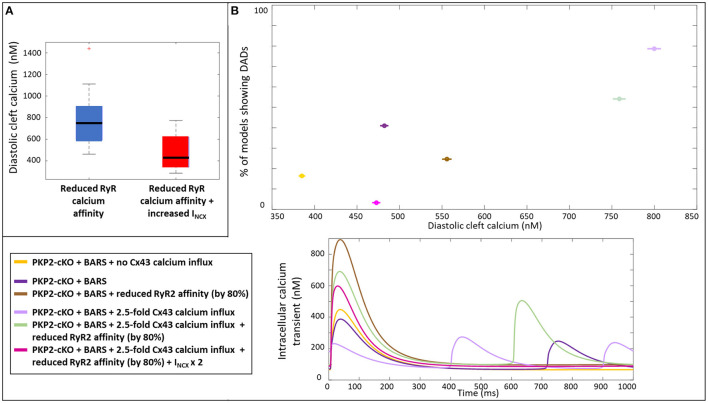
Figure 7.
(A) Diastolic cleft calcium levels upon a reduced RyR2 calcium affinity (blue) and on top of that an increased INCX (red). (B) Percentage of models showing DADs, plotted against the diastolic cleft calcium levels presented for six different situations in the PKP2-cKO model (top); Corresponding calcium traces (bottom).

