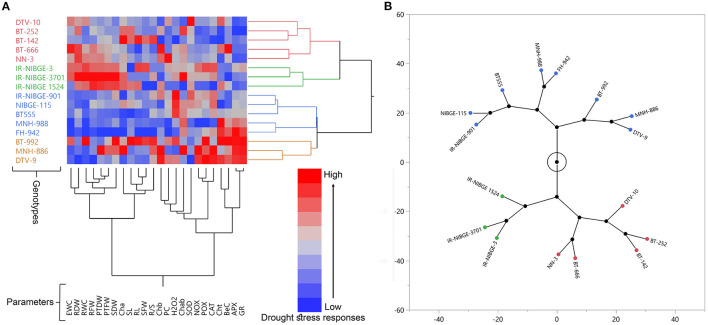
Figure 2.
Drought stress responses and variation among a panel of diverse 16 cotton genotypes. Hierarchical Cluster and Dendrogram on the bases of seedling traits (A), and Constellation Plot (B). Genotypes are distributed in two major and four minor groups. In contrast, evaluated parameters are distributed in two major and five minor groups (A).

