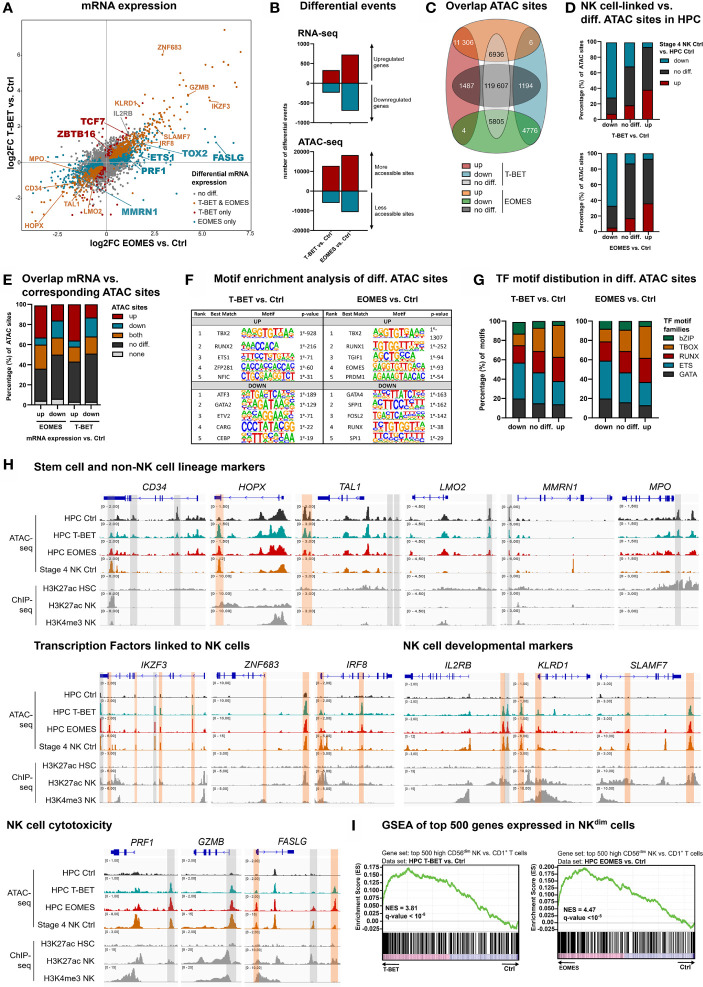
Figure 1.
Epigenetic regulation by T-BET or EOMES overexpression in human HPC results in an NK cell transcriptome. Human eGFP+CD34+ HPC transduced with control, T-BET or EOMES constructs were sorted at day 0 (after 48 h of transduction) and RNA-seq (n=5) and Fast-ATAC-seq (n=3) was performed. (A) Fold change plots illustrating differential mRNA expression of T-BET or EOMES transduced versus control transduced HPC. Blue and red dots indicate T-BET- and EOMES-specific differential genes, respectively. Orange dots indicate genes differentially regulated by both overexpression constructs. Selected differential genes are highlighted. (B) Bar charts showing the number of differential events of RNA- and ATAC-seq for T-BET- or EOMES-overexpressing versus control HPC. (C) Overlap analysis of differential ATAC sites in HPC overexpressing T-BET versus EOMES. (D) NK cell-linked ATAC sites were defined as differential ATAC sites of stage 4 control NK cells versus control HPC. These were then compared to the differential ATAC regions of T-BET- or EOMES-overexpressing versus control HPC. Bar charts show relative numbers of ATAC sites. (E) Overlap analysis of up- or downregulated mRNA and the indicated subgroups of ATAC sites for T-BET- or EOMES-overexpressing HPC. Relative numbers of ATAC sites are shown in the bar chart. (C–E) Up = upregulated sites; down = downregulated sites; both = up- and downregulated sites; no diff = detectable sites without differential expression compared to control cultures; none = non-detectable sites. (F, G) Motif enrichment analysis of up- or downregulated, or non-differential ATAC sites of T-BET- or EOMES-overexpressing HPC. (F) The top 5 best matched motifs are indicated. (G) The relative presence of the indicated motif families is shown. (H) Representative Genome Browser views of selected gene loci, showing tracks of ATAC-seq for the indicated HPC samples and stage 4 control NK cells, and H3K27ac and/or H3K4me3 ChIP-seq of HPC and mature NK cells. Differentially regulated ATAC regions are indicated in grey or orange, whereby the orange colored regions contain a T-BOX motif. (I) Gene set enrichment analysis (GSEA) shows a significant enrichment of CD56dim signature genes in T-BET- or EOMES-overexpressing vs. control HPC. Normalized enrichment scores (NES) and q-values are indicated. See also Supplementary Figure 1 .

