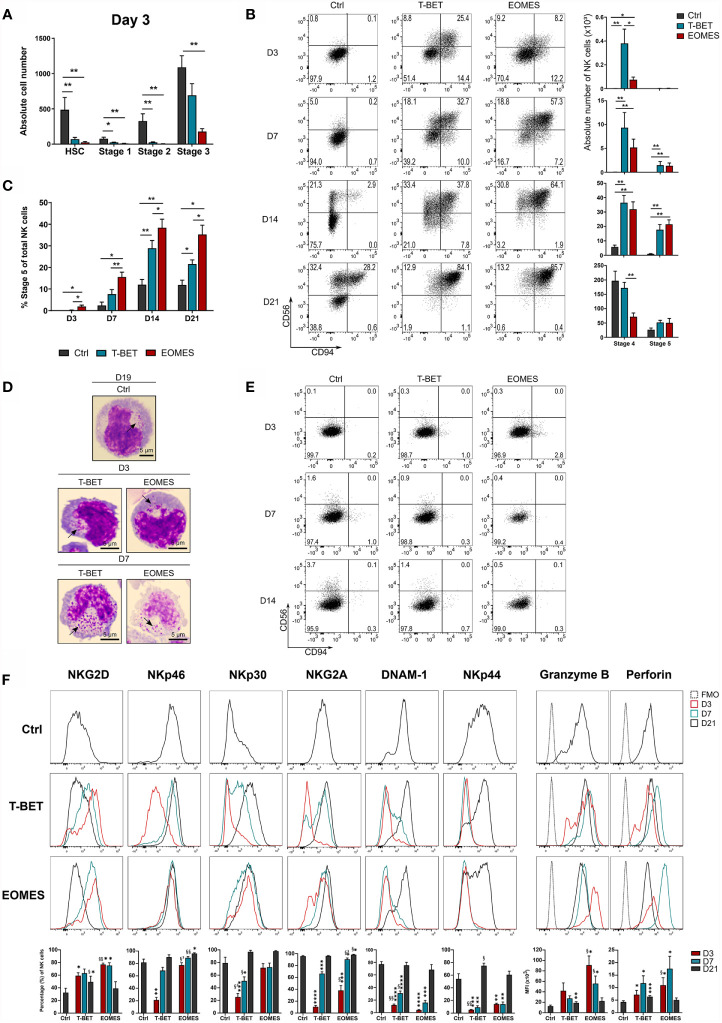
Figure 2.
NK cell differentiation upon T-BET or EOMES overexpression in human HPC is drastically accelerated. T-BET, EOMES or control transduced HPC were cultured in the in vitro NK cell differentiation co-culture. Cultures were analyzed by flow cytometry on pre-gated eGFP+CD45+ cells on different time points as indicated. (A) Absolute cell numbers of HSC (CD34+CD45RA-), stage 1 (CD34+CD45RA+CD117-), stage 2 (CD34+CD45RA+CD117+) and stage 3 cells (CD34-CD117+CD94-) at day 3 of culture (mean ± SEM; n = 5-6). (B) Representative dot plots of CD11a+ gated cells at the indicated days of culture. Cells in the upper right quadrant represent the CD56+CD94+ NK cell population. The numbers in the plots indicate the percentages. Absolute cell numbers of stage 4 (CD16-) and stage 5 (CD16+) NK cells are shown in the bar charts (mean ± SEM; n = 6-9). (C) Percentages of stage 5 (CD16+) of total NK cells is shown (mean ± SEM; n = 6-9). (D) Microscopic images of sorted CD56+CD94+ NK cells on day 3 and 7 of overexpression cultures and on day 19 of control cultures. Arrows indicate cytotoxic granules. 100x magnification. Scale bar = 5µm. (E) Representative dot plots of CD11a+ gated cells from cultures in the absence of exogenous IL-15. (F) Representative histograms of the indicated NK cell markers of gated NK cells (CD11a+CD56+CD94+), whereby the overexpression conditions at different days of culture are compared to day 21 control NK cells. The fluorescence minus one (FMO) is included as background fluorescence. Percentages or MFI of the indicated marker is presented in the bar charts (mean ± SEM; n = 6-12). *, **, *** and **** indicate significant difference of the specified overexpression condition compared to the control, with p<0.05, <0.01, <0.001, <0.0001, respectively. §, §§ and §³ indicate significant difference of T-BET vs. EOMES overexpression, with p<0.05, <0.01, 0.001, respectively. See also Supplementary Figure 2 .

