Figure 4.
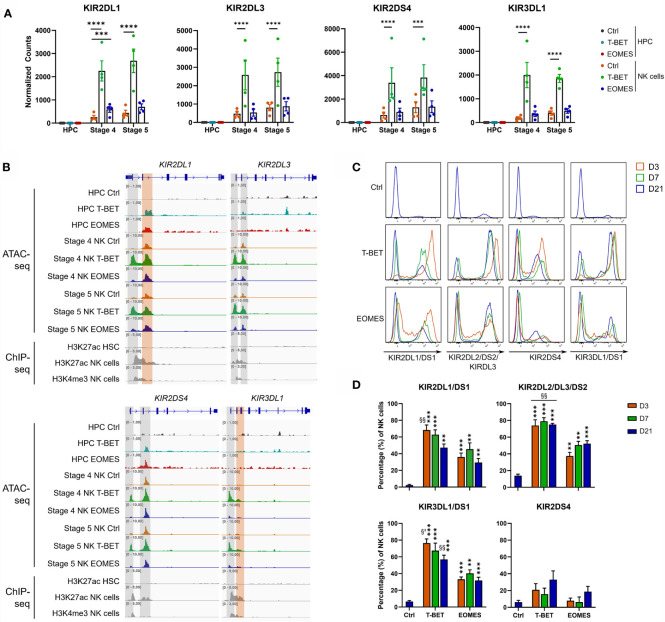
T-BET overexpression epigenetically regulates increased KIR expression in NK cells. (A) Normalized counts (mean ± SEM; n = 4-5) are shown from the RNA-seq analysis of the indicated KIR genes in day 0 HPC and day 21 stage 4 and stage 5 NK cell populations. The dots represent individual donors. (B) Representative Genome Browser views of the indicated KIR genes, showing tracks of ATAC-seq for all above mentioned cell populations and of H3K27ac and/or H3K4me3 ChIP-seq of HPC and mature NK cells. (C, D) Day 21 T-BET, EOMES or control NK cells were analyzed by flow cytometry for KIR expression on different time points as indicated. Representative histograms are shown in (C), percentages of KIR+ cells in the NK cell population are demonstrated in (D) (mean ± SEM; n = 5-8). "**, *** and **** indicate a significant difference compared to the control with p<0.01, p<0.001 and p<0.0001, respectively. §§ and §³ indicate a significant difference of T-BET vs. EOMES overexpression, with p<0.01 and p<0.001, respectively.

