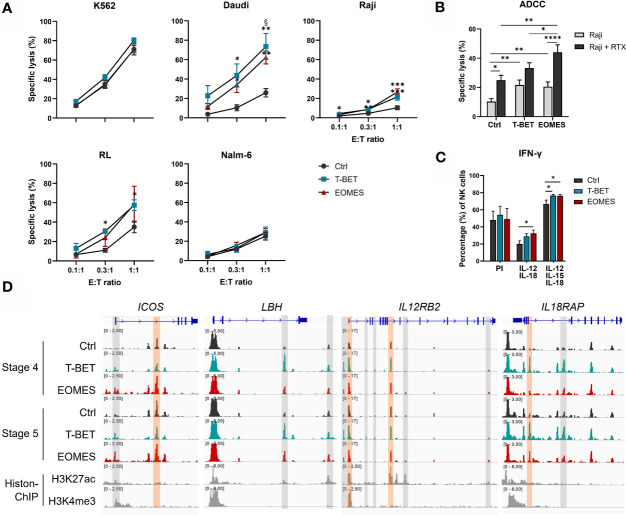
Figure 5.
T-BET and EOMES NK cells are functional and EOMES NK cells have enhanced ADCC activity. (A, B) Sorted day 21 NK cells (eGFP+CD45+CD11a+CD56+CD94+) of control, T-BET and EOMES overexpression conditions were challenged with the indicated cell lines at different effector over target (E:T) ratios. (A) The percentage of specific target cell lysis is shown (mean ± SEM; n = 2-15). (B) ADCC assay with Raji target cells in the absence or presence of Rituximab (RTX) (E:T ratio = 1:1). The percentage specific target cell lysis is shown (mean ± SEM; n=15). (C) Intracellular IFN-γ production after 24 h stimulation with PMA and Ionomycin (PI) or with a combination of IL-12 and IL-18 in the presence or absence of IL-15. Bar charts represent the percentage of IFN-γ+ cells in the gated NK cell population (mean ± SEM; n=6). (A–C) *, **, *** and **** indicate a significant difference, with p<0.05, p<0.01, p<0.001 and p<0.0001, respectively. § indicates a significant difference of T-BET vs. EOMES overexpression, with p<0.05. (D) Representative Genome Browser views of the indicate genes, showing tracks of ATAC-seq in stage 4 and stage 5 NK cells from both overexpression and control samples, and H3K27ac and H3K4me3 ChIP-seq of mature NK cells. Colored ATAC regions are differentially regulated and only the regions indicated in orange contain a T-BOX motif. See also Supplementary Figure 5 .

