
FIGURE 2.
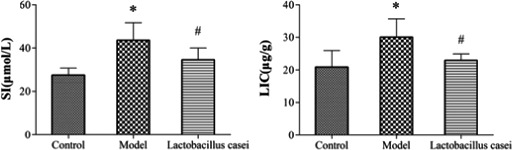
Effects of L. casei on serum iron and liver iron concentration. SI: serum iron; LIC: liver iron concentration; Control: the control group; Model: the model group; Lactobacillus casei: the L. casei group. * p < .05 versus the control group, # p < .05 versus the model group