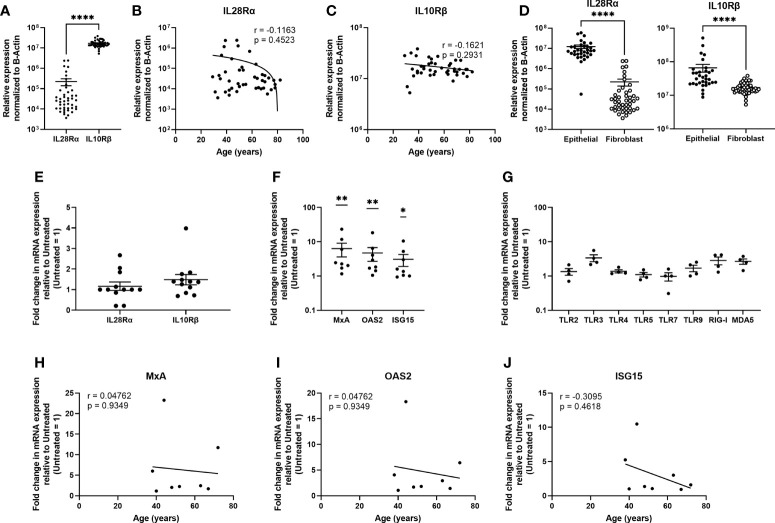
Figure 6.
Uterine stromal fibroblasts express Type III IFN receptors and respond to IFNλ1 by upregulating ISGs and pattern recognition receptors. (A) mRNA from uterine stromal fibroblasts was recovered and analyzed for relative expression of IL28Rα and IL10Rβ normalized to β-Actin. Each circle represents an individual patient (n = 44). Values for IL28Rα (B) and IL10Rβ (C) from panel A were plotted against patient age. Each circle represents an individual patient (n = 44) (D) Comparison of IL28Rα and IL10Rβ mRNA expression between non-matched uterine epithelial cells (n = 33) and uterine stromal fibroblasts (n = 44). Each circle represents an individual patient. (E) Fold change in mRNA expression of IL28Rα and IL10Rβ following stimulation of uterine stromal fibroblasts with poly (I:C) (25ug/ml) for 24 hrs. Each circle represents an individual patient (n = 12). (F) mRNA expression of MxA, OAS2, and ISG15 by primary uterine stromal fibroblasts following treatment with IFNλ1 (500 ng/ml) for 24 hrs. Untreated control = 1. Each circle represents an individual patient (n = 8) (G) mRNA expression of TLR2, TLR3, TLR4, TLR5, TLR7, TLR9, RIG-I, and MDA5 by primary uterine stromal fibroblasts following treatment with IFNλ1 (500 ng/ml) for 24 hrs. Untreated control = 1. Each circle represents an individual patient (n = 4). (I–K) Values for MxA, OAS2, and ISG15 mRNA expression from panel (F) were plotted against patient age. Each circle represents an individual patient (n = 8). mRNA expression data in panels (A–D) is normalized to the housekeeping gene β-Actin. mRNA expression data in panels (E, F–J) is normalized to the housekeeping gene β-Actin, and then further normalized to the untreated control whose value is set to 1. Data is shown as mean +/- SEM. Each circle represents an individual patient. Wilcoxon matched-pairs signed rank test (A). Non-parametric Spearman correlation analysis (B, C, H–J). Mann-Whitney t-test (D). One-sample non-parametric Wilcoxon test (E, F, G). *p < 0.05; **p < 0.01; ****p < 0.0001.

