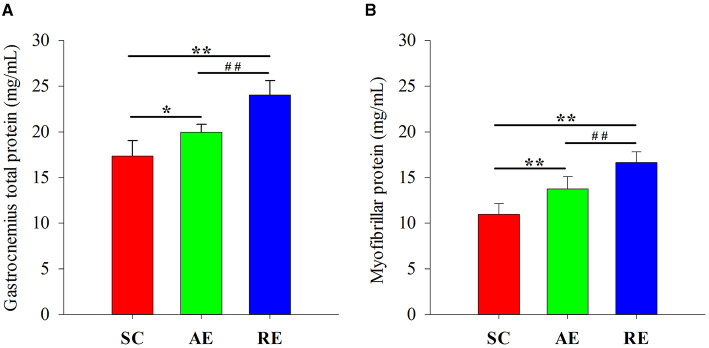
Figure 2.
Effects of exercise on (A) total and (B) myofibrillar protein concentration in gastrocnemius muscle. Values are provided as mean ± standard deviation for each group. SC, sedentary control group; AE, aerobic exercise training group; RE, resistance training exercise group. *P < 0.05 vs. the SC group; **P < 0.01 vs. the SC group; ##P < 0.01 vs. the AE group.

