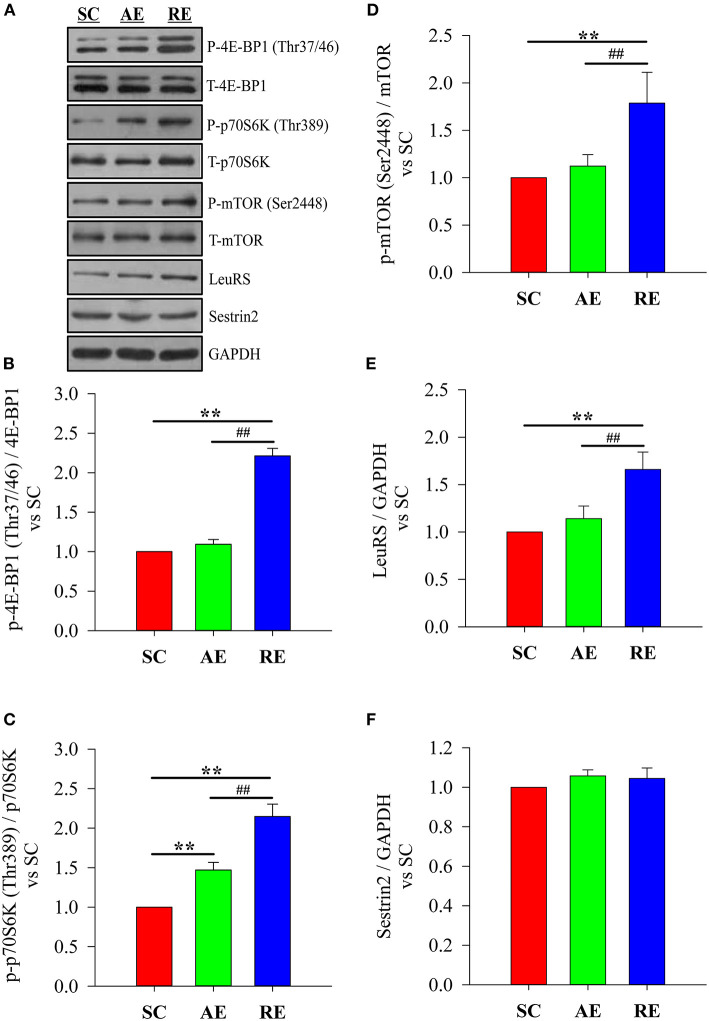
Figure 3.
Effects of exercise on protein expression with relation to leucine-sensing. (A) blotting, (B) phosphorylation state of 4E-BP1 (Thr37/46), (C) phosphorylation state of p70S6K (Thr389), (D) phosphorylation state of mTOR (Ser2448), (E) relative expression of LeuRS and (F) relative expression of Sestrin2. SC, sedentary control group; AE, aerobic exercise training group; RE, resistance training exercise group. Data were expressed relative to the SC group. The expression of LeuRS and Sestrin2 were normalized to GAPDH. The phosphorylation state of mTOR signaling was calculated as the ratio of phosphorylated protein to total. **P < 0.01 vs. the SC group; ##P < 0.01 vs. the AE group.

