FIGURE 1.
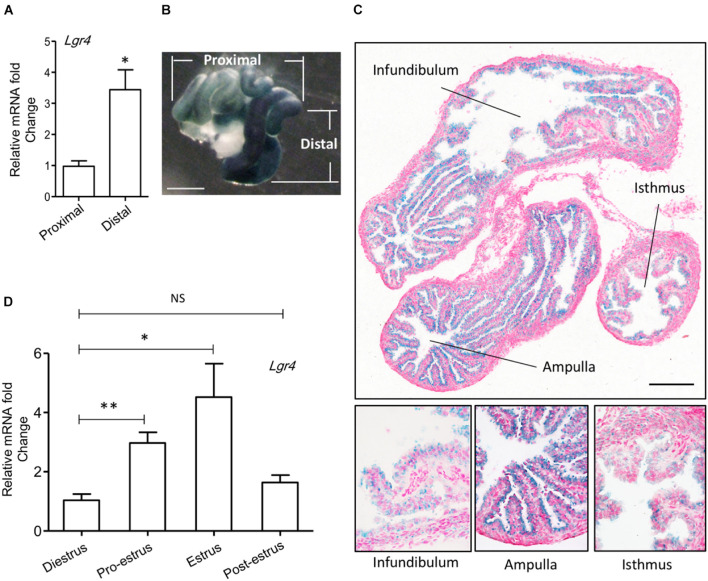
Expression of Lgr4 in oviducts of mice. (A) The relative expression of Lgr4 mRNA in the specific regions of the oviduct of the WT mice. (B) A whole mount LacZ staining represented the spatial expression pattern of Lgr4 in a heterozygous mouse oviduct. (C) A LacZ staining of a cryo-section of an Lgr4 heterozygous mouse oviduct. (D) The relative expression of Lgr4 mRNA in the mouse oviduct at different stages of the estrus cycle. At least three independent experiments were carried out. Data are presented as mean ± SEM of three mice. ∗p ≤ 0.05; ∗∗p ≤ 0.01. Scale bar, 1,000 μm in (B); 200 μm in (C).

