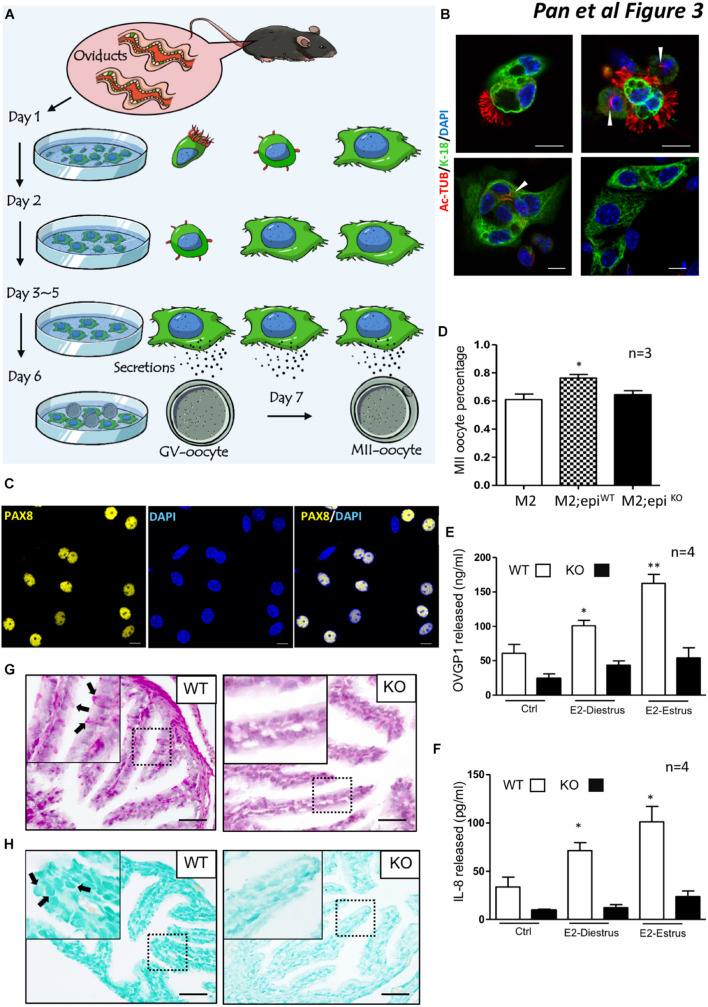
FIGURE 3.
Secretion deficiencies in the oviducts of Lgr4 KO mice. (A) A schematic showing the procedure for mouse oviduct epithelial cell–oocyte co-culture system. (B) Immunofluorescence analysis of cytokeratin 18 (KRT-18) and alpha-tubulin (Ac-Tub) to the mouse oviduct epithelial cells. (C) Immunofluorescence analysis of PAX8. (D) The average percentage of the MII oocytes in response to different treatments. (E) The released protein level of OVGP1. (F) The released protein level of IL-8. (G) The periodic acid–Schiff (PAS) staining between the WT and Lgr4 knockout oviduct. (H) The Alcian blue staining between the WT and Lgr4 knockout oviduct. ∗p ≤ 0.05; ∗∗p ≤ 0.01. Scale bar, 10 μm in (B,C), 25 μm in (G,H). At least three independent experiments were carried out.

