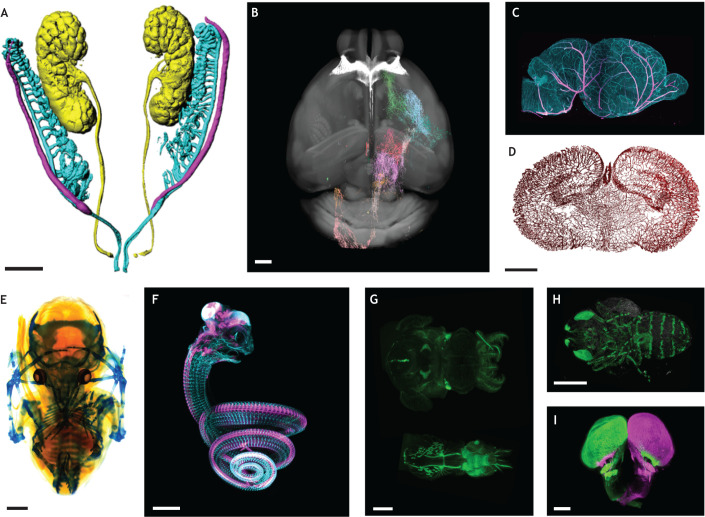
Fig. 5.
Examples of applications of tissue clearing to developmental biology. (A-D) Examples of image analysis. (A) Imaris surface segmentation of a GW8 human embryo, showing the urogenital system. This type of semi-automated segmentation allows researchers to highlight structures of interest, even in complex or noisy data (Belle et al., 2017). (B) Automated axon segmentation of cortico-fugal projections of the barrel cortex with TrailMap, annotated to the mouse Allen Brain Atlas template (https://allensdk.readthedocs.io/en/latest/reference_space.html) with the regional color code of the Allen Brain Atlas. The brain reference template is shown in gray for orientation. (C) 3D view and sagittal projection (300 µm thickness) of a P2 mouse brain stained for the vasculature [CD31/podocalyxin (blue); Sm22 (pink)] with iDISCO+. (D) Coronal slice of the vascular graph from C obtained through an automated segmentation using TubeMap (ClearMap2). Blood vessels were automatically segmented from the 3D scan obtained in C, and embedded into a graph representation, with vessels coded as edges and bifurcations as nodes. The image shows a 3D coronal slice through the reconstructed graph, which reveals the orientations and densities of vessels across different brain regions. Images in B-D kindly provided by Grace Houser and Elisa de Launoit (Paris Brain Institute, France; unpublished). (E-I) Applications of tissue clearing to evo-devo studies. (E) Short-tailed fruit bat (Carollia perspicillata) in developmental stage 19, stained with Alcian Blue and cleared with BABB, imaged with a bright-field stereomicroscope. Image kindly provided by Idoia Quintana-Urzainqui, Paola Bertucci, Peter Warth, Chi-Kuo Hu and Richard Behringer (University of Texas MD Anderson Cancer Center, TX, USA; unpublished). (F) 3D view of an African house snake embryo (8 days post oviposition) stained for Robo3 (red) and βIII-Tub (green) with 3DISCO and imaged with a light-sheet ultramicroscope. Image kindly provided by Alain Chédotal (The Vision Institute, France), produced as described in Friocourt et al. (2019). (G) Longfin inshore squid and Hawaiian bobtail squid stained for acetylated tubulin with the DEEPClear protocol. Adapted from Pende et al. (2020). (H) Fruit fly (Drosophila melanogaster) pupa expressing GFP in sensory neurons, cleared with FlyClear (Pende et al., 2018). Images (G,H) kindly provided by Marco Pende (Vienna University of Technology, Austria). (I) 3D light-sheet image of the brain of a spotted gar injected in the eyes with two cholera toxin β tracers (Vigouroux et al., 2021). Scale bars: 400 µm.

