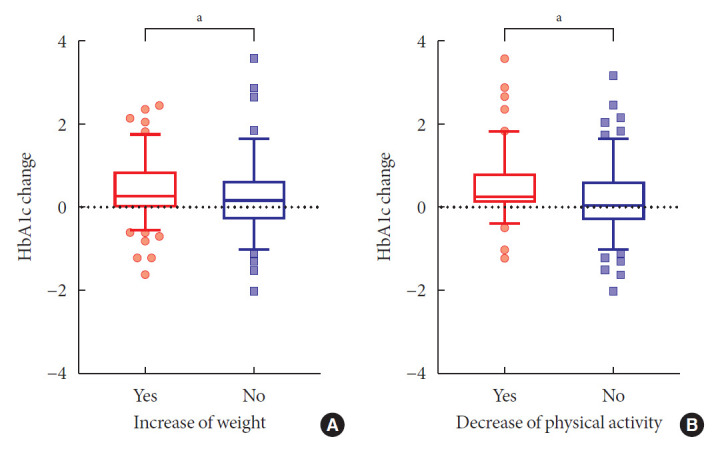
Fig. 1.

The pattern of changes in glycated hemoglobin (HbA1c) levels in the two groups according to changes in body weight and physical activity. Box and whisker plots of HbA1c levels. Whiskers represent the 5th and 95th percentiles. (A) Change in body weight. (B) Change in physical activity. aP<0.05, t-test.
