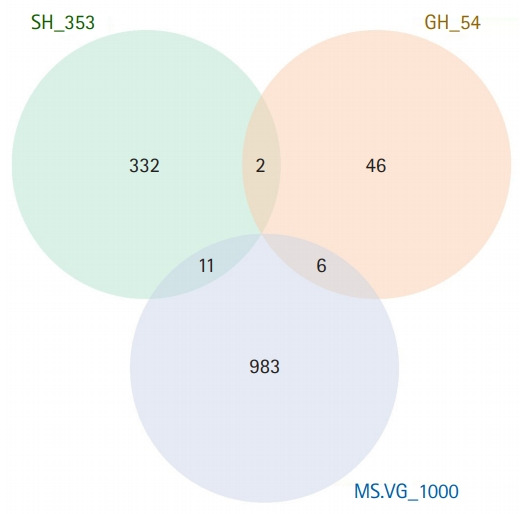
Fig. 2.

A Venn diagram of three sets of genes. SH_353 represents genes annotated for 353 CpGs used in the DNA methylation age model.16) GH_54 represents genes annotated for 71 CpGs used to determine the apparent methylomic aging rate.15) MS.VG_1000 represents top 1,000 genes whose transcript levels are important in predictive modeling of chronological age.37)
