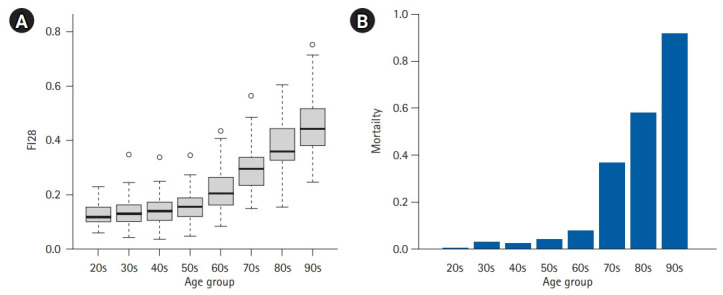
Fig. 3.

Exponential increase in the frailty index and mortality. (A) Box plot of FI28 scores of 592 individuals in the Louisiana Healthy Aging Study.51) FI28 is a frailty index based on 28 health items. Each box represents an inter-quartile range with the line in the middle showing the median position. (B) Proportions of the deceased in the same age groups.
