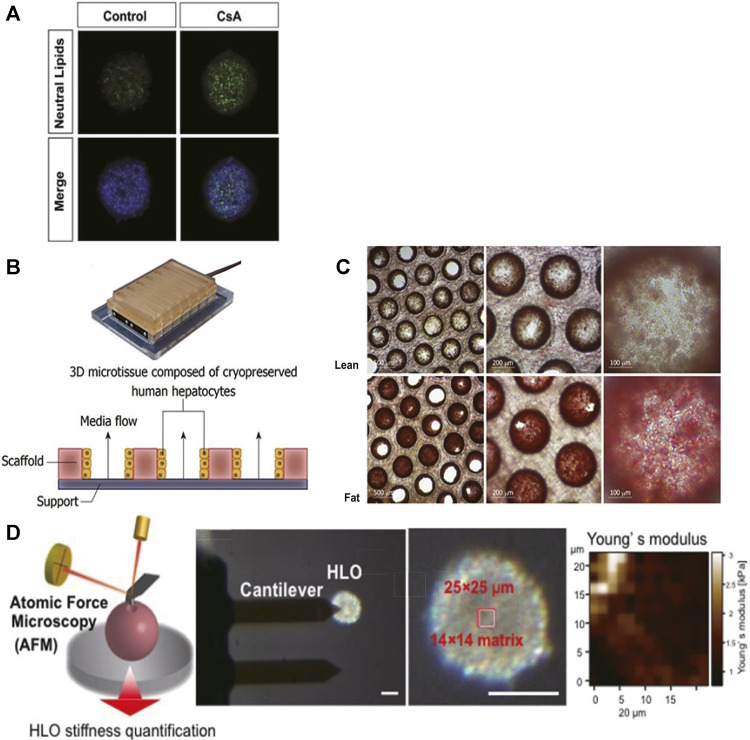
FIGURE 2.
3D cell culture paradigms support disease modeling of NAFLD. (A) Representative pictures of lipid accumulated in PHH spheroids upon exposure to cyclosporine A (30 μM) for 48 h; scale bars, 100 μm. (B) Illustration of the PHH liver-on-a-chip model. (C) Intracellular fat accumulation in the liver-on-a-chip model under fat condition (Lower) was noted after Oil Red O staining. (D) Schematic demonstration of stiffness measurement by AFM. The top region of each single organoid (14 × 14 matrix in a 25 × 25 μm square) was scanned with an AFM cantilever. Scale bar, 100 μm. Young’s modulus on each scanned spot is shown in the heatmap. (A) Modified with permission from Bell et al. (2016). (B,C) Modified with permission from Kostrzewski et al. (2017). (D) Modified with permission from Ouchi et al. (2019).

