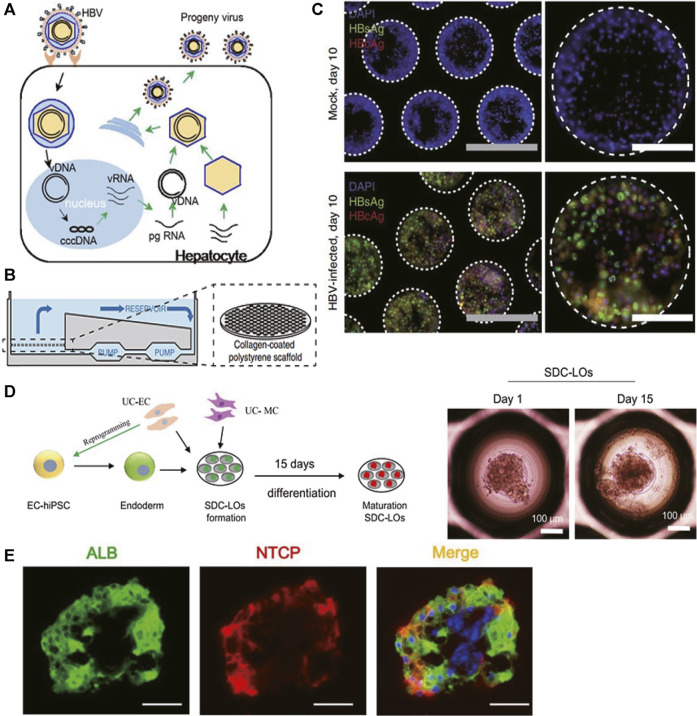
FIGURE 3.
Selected representative 3D models of viral hepatitis B. (A) Schematic representation of the HBV life cycle in infected hepatocytes. (B) Illustration of the PHH liver-on-a-chip model. Microfluidic recirculation was driven by a micro-pump and went through collagen-coated polystyrene scaffolds seeded with PHHs. (C) Immunofluorescence of HBV viral antigens (HBsAg and HBcAg) 10 days following infection of the PHH liver-on-a-chip model with patient-derived HBV (100 GE/cell). (D) (Left) Schematic representation of the protocol for liver organoid generation and differentiation from single donor umbilical cord (UC)-derived hiPSCs, HUVECs, and mesenchymal cells (MCs). (Right) Morphology of single donor cell–derived liver organoids (SDC-LOs) on days 1 and 15. Scale bars, 100 μm. (E) Immunofluorescence staining of ALB and NTCP in differentiated SDC-LOs. Green, ALB; red, NTCP. Scale bars, 50 μm. (A) Modified with permission from Yan et al. (2012). (B,C) Modified with permission from Ortega-Prieto et al. (2018). (D,E) Modified with permission from Nie et al. (2018).

