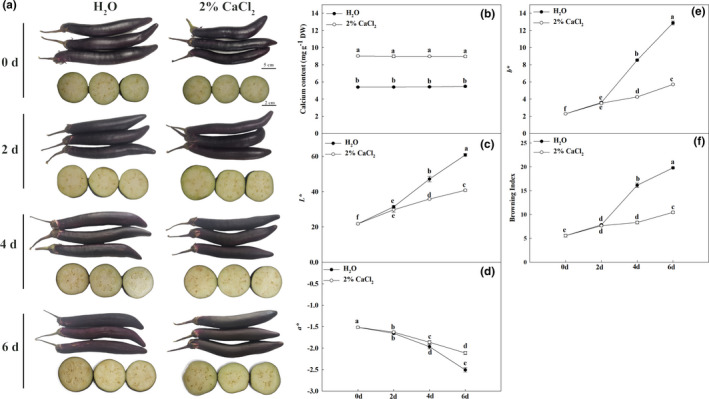
FIGURE 2.

Calcium treatment delayed the browning of eggplant during storage. (a) Phenotypes of H2O‐ and calcium‐treated fruits. Upper part: the appearance of H2O‐ and calcium‐treated fruits, bar = 5 cm. Lower part: the browning phenotypes of transection of H2O‐ and calcium‐treated fruits, bar = 2 cm. (b) The calcium content in H2O‐ and calcium‐treated fruits. (c) The L* in H2O‐ and calcium‐treated fruits. (d) The a* in H2O‐ and calcium‐treated fruits. (e) The b* in H2O‐ and calcium‐treated fruits. (f) The BI in H2O‐ and calcium‐treated fruits. Data are means of three replicates with SD. Asterisks denote statistically significant differences between calcium‐ and H2O‐treated fruits (p < .05, ANOVA)
