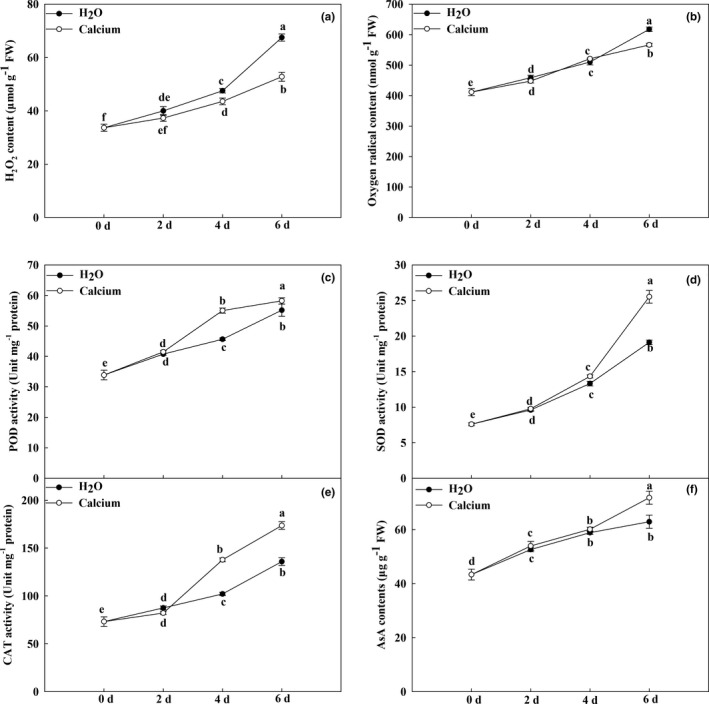
FIGURE 5.

Changes in ROS levels and antioxidant activities during storage. Changes in H2O2 (a), O2 − (b), and AsA (f) content during storage. Change in POD (c), SOD (d), and CAT (e) activities during storage. Data are means of three replicates with SD. Different letter indicated significant differences, according to one‐way ANOVA and Tukey's multiple range tests (p < .05)
