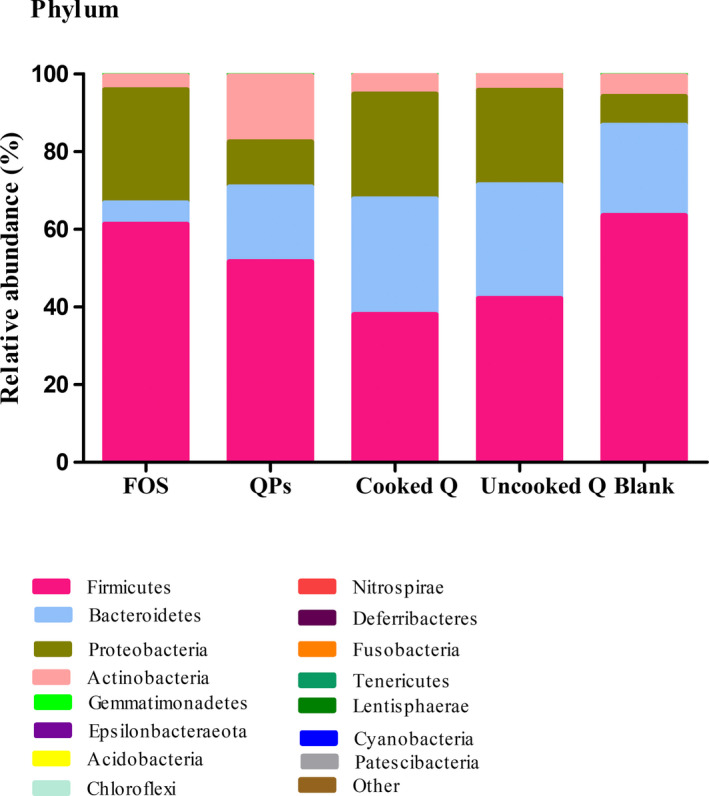
FIGURE 3.

Relative abundances of gut microbial phylum before and after fermentation. QPs, quinoa polysaccharides; FOS, Fructooligosaccharide; Blank, before fermentation. Results are expressed as the average value of triplicates

Relative abundances of gut microbial phylum before and after fermentation. QPs, quinoa polysaccharides; FOS, Fructooligosaccharide; Blank, before fermentation. Results are expressed as the average value of triplicates