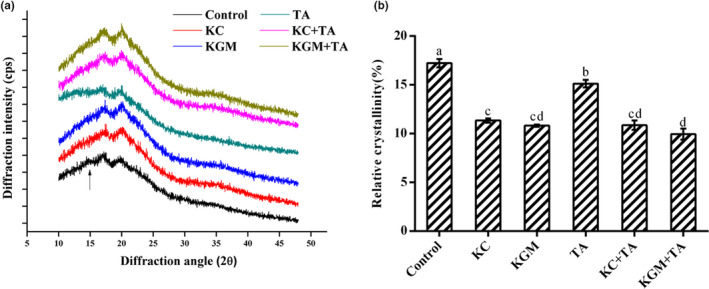
FIGURE 3.

Effect of different combinations of konjac glucomannan, κ‐carrageenan, and tannic acid on X‐ray diffraction pattern of wheat starch samples. (a) XRD pattern of freeze‐dried wheat starch samples. The arrow indicates the gradually disappeared crystalline diffraction peak at 15°. (b) Relative crystallinity. Data are given as mean ± SEM, calculated from three replicates. Values within the column followed by different letters indicate significant difference (p < .05)
