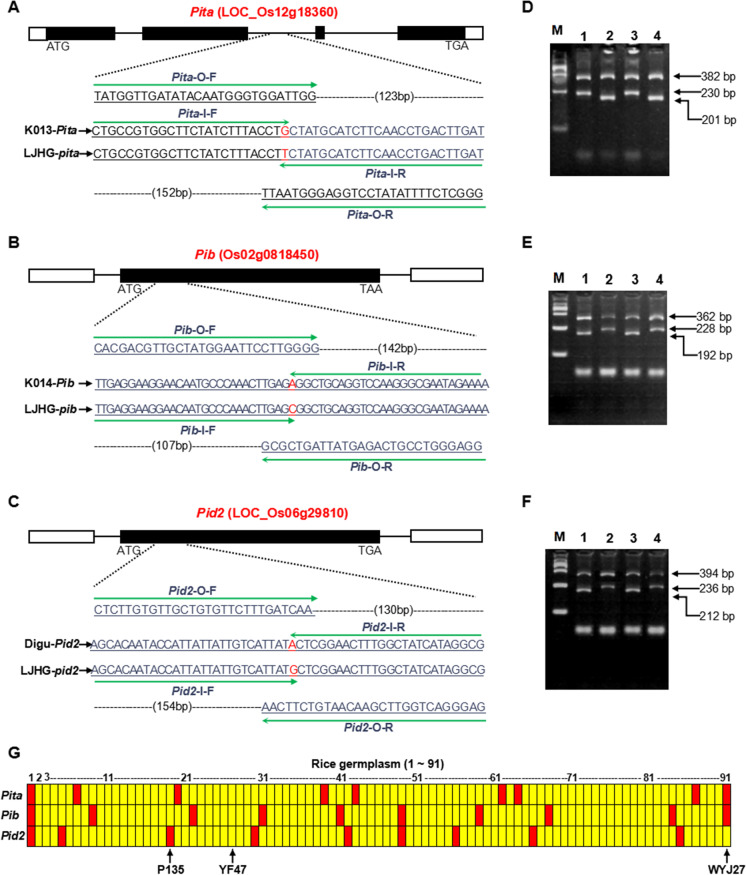
Fig. 1.
TPAP primer design and detection of Pita, Pib, and Pid2 alleles. Design strategy for TPAP–Pita (A), TPAP–Pib (B), and TPAP–Pid2 (C) markers. Functional SNPs are shown in red; underlines show primer binding sites. PCR assay of Pita (D) between resistant (K103, lanes 1 and 3) and susceptible (LJHG, lanes 2 and 4) genotypes in two repeats; Pib (E) between resistant (K104, lanes 2 and 4) and susceptible (LJHG, lanes 1 and 3) genotypes in two repeats; Pid2 (F) between resistant (Digu, lanes 1 and 3) and susceptible (LJHG, lanes 2 and 4) genotypes in two repeats. M, marker 2000. G Genotype analysis of Pita, Pib, and Pid2 on 91 rice germplasm using TPAP–Pita, TPAP–Pib, and TPAP–Pid2. Nos. 1–2 are the resistance check and susceptibility check of Pita, Pib, and Pid2, corresponding to K013 and LJHG, K014 and LJHG, and Digu and LJHG, respectively; Nos. 3–48, 49–63, 64–67, 68–82, 83–87, and 88–91 are japonica germplasms collected from Liaoning, Ningxia, Tianjin, Xinjiang, Jilin, and Jiangsu provinces, respectively. The yellow regions represent susceptible genotypes, and the red regions represent the resistance genotypes YF47, Yanfeng47, and WYJ27, Wuyunjing27

