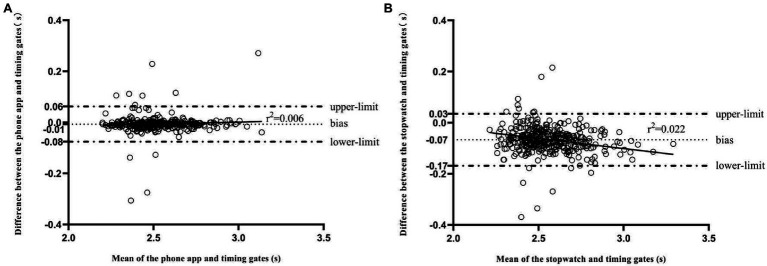
Figure 3.
Bland-Altman plots for the measurement of completion time between devices: (A) phone app and timing gates; (B) stopwatch and timing gates. The central thin dashed line represents the absolute average difference between devices, and upper and lower horizontal lines represent the observed bias with 1.96 standard deviations (SD), while the solid line is the regression line of the residual.

