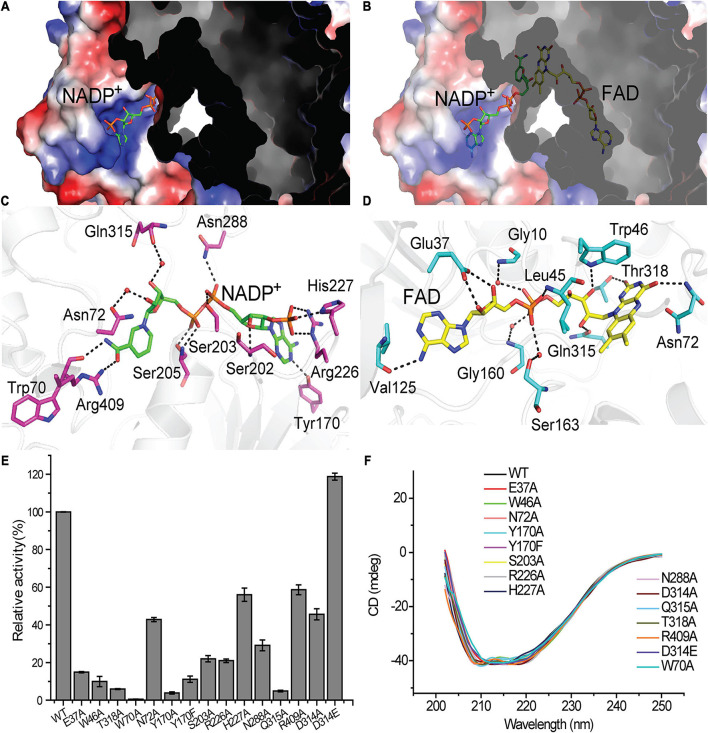
FIGURE 3.
The binding of the NADP+ molecule and the FAD molecule in Tmm7211. The NADP+ molecule and the FAD molecule are shown as sticks colored in green and yellow, respectively. (A) Electrostatic surface of Tmm7211. The NADP+ molecule is partially visible through the surface. (B) Electrostatic surface of Tmm7211 after the transparency of surface was set to 40%. (C) Interactions between NADP+ and Tmm7211 residues. (D) Interactions between FAD and Tmm7211 residues. Water molecules are shown in red dots. The possible hydrogen bonds are represented by dashed lines. (E) The enzymatic activities of WT Tmm7211 and its mutants. The activity of WT Tmm7211 is taken as 100%. The standard errors are from three independent experiments. (F) CD spectra of WT Tmm7211 and its mutants.

