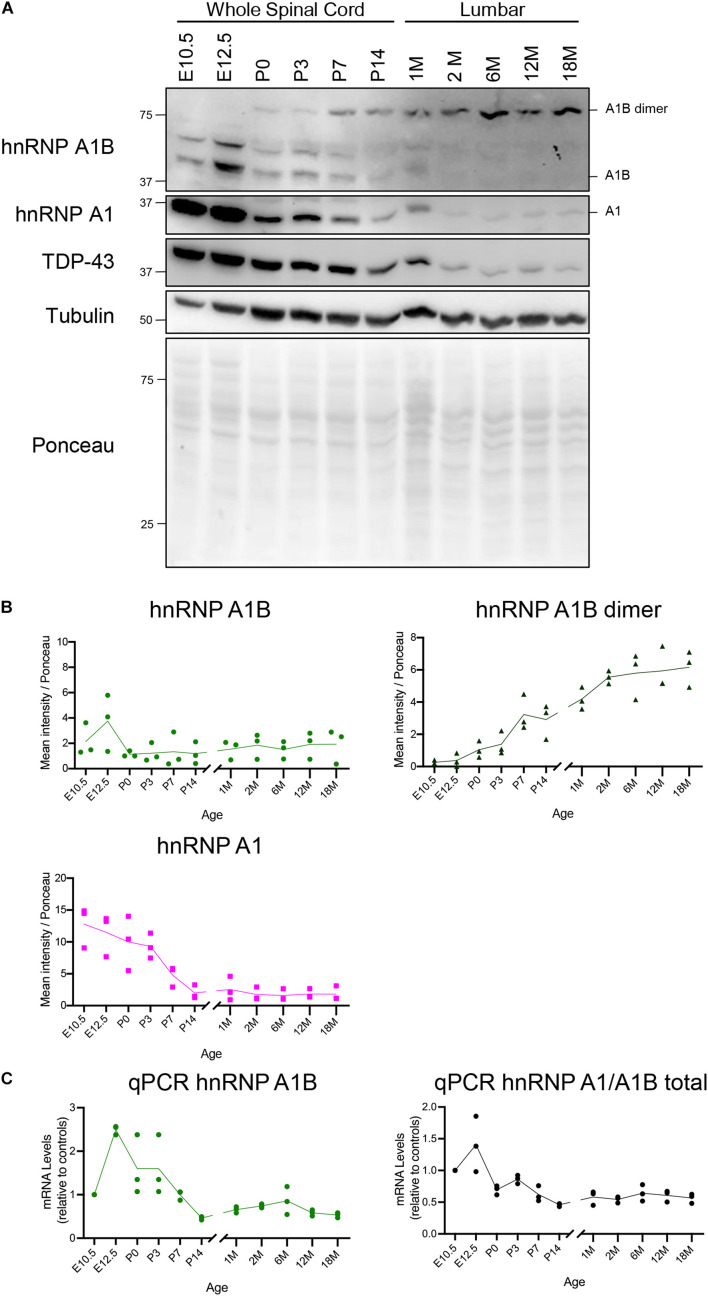
FIGURE 2.
Expression of hnRNP A1B in the spinal cord throughout development and aging. (A) Immunoblot of mouse spinal cord at different ages, when possible the lumbar region was micro-dissected before lysis, blots are representative of n = 3. (B) Quantification of the mean intensity of hnRNP A1B (top left), dimeric hnRNP A1B (top right) and hnRNPA1 (bottom left) normalized to Ponceau, n = 3, two-way ANOVA (time variation: hnRNP A1B p = 0.1616, hnRNP A1B dimer p < 0.0001, hnRNP A1B dimer p < 0.0001). (C) qPCR of hnRNP A1B and hnRNP A1/A1B total mRNA levels expressed relative to the average of housekeeping control genes, n = 3, 2-way ANOVA (time variation: hnRNP A1B p = 0.0039).

