Figure 2.
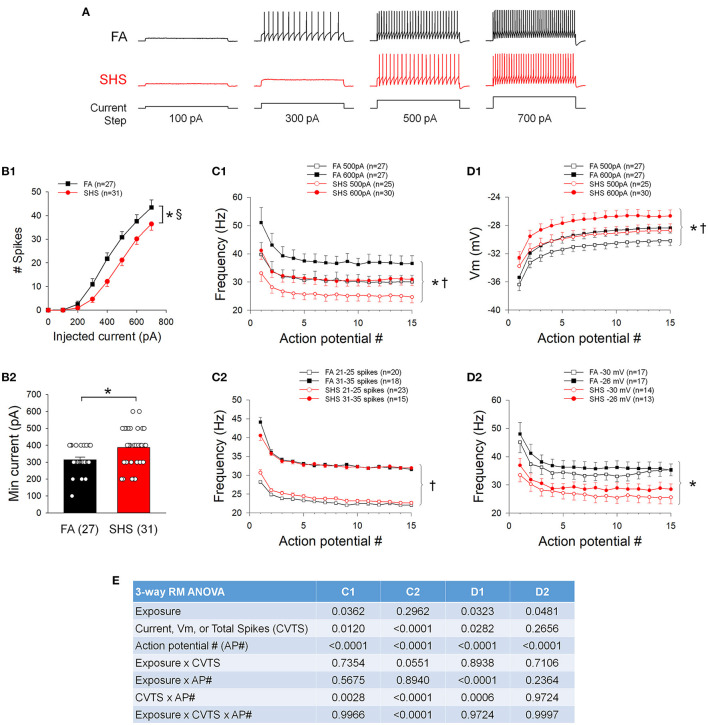
Effects of SHS on neuronal response to 1 s depolarizing current steps. (A) Example traces of depolarizing current injection induced spiking responses of CVNs from one filtered air (FA) and one secondhand smoke (SHS) exposed group. (B1) Total number of spikes discharged to 1 s depolarizing current steps. CVNs from the SHS exposed group had a lower spiking response compared to those from the FA group (two-way repeated measures ANOVA: p = 0.017 for exposure, p < 0.001 for injected current and p < 0.001 for interaction). (B2) Minimum current that evoked an AP was significantly higher in the SHS group (Mann-Whitney Rank Sum Test, p = 0.012). (C1) Instantaneous frequency of the first 15 APs at injected currents of 500 and 600 pA. Neurons from both groups showed similar frequency adaptation, albeit lower overall frequency in the SHS group compared to the FA control group. (C2) Instantaneous frequency of the first 15 APs from neurons discharged a total of 21–25 spikes and 31–35 spikes in response to 1 s depolarizing current steps, further demonstrate that there was no difference in frequency adaptation between FA and SHS exposed groups. (D1) Membrane voltage (Vm) at 500 and 600 pA current steps. Compared to the FA group, the membrane voltage was significantly more depolarized in the SHS group at each injected current, suggesting that the reduced spiking response in SHS group is not due to a more hyperpolarized membrane voltage at each injected current. (D2) Instantaneous frequency of the first 15 action potentials at two membrane voltages (−31 to −29 mV and −27 to −25 mV for −30 and −26 mV, respectively) demonstrating that the reduced spiking activity in SHS group persisted at similar membrane voltages. (E) Three-way repeated measures ANOVA results for panels (C1,C2,D1,D2). *p < 0.05 SHS vs. FA, †p < 0.05 main effects for current or total spikes, §p < 0.05 exposure x current interaction.

