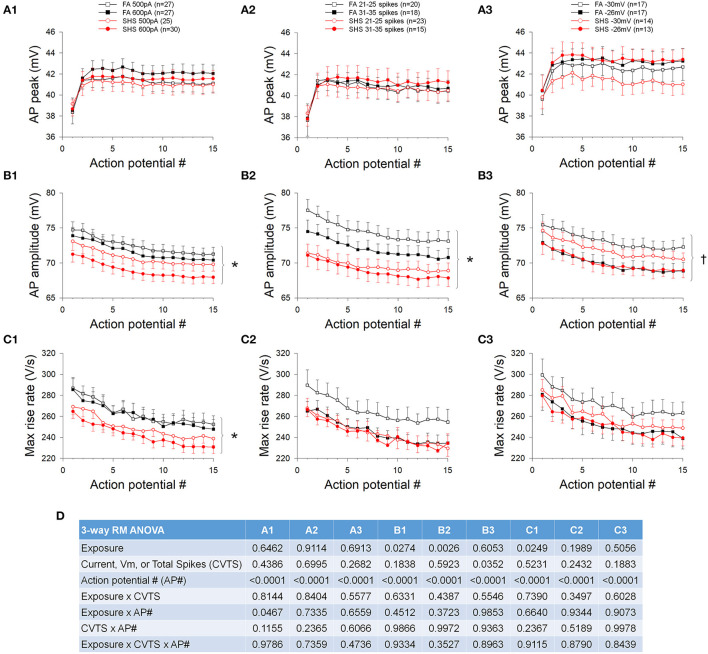
Figure 3.
Effects of SHS on AP upstroke characteristics of the first 15 APs during step current injections. (A) Absolute AP peak voltage. There was no significant exposure effect on the AP peak whether grouping the data with same injected currents (A1), total number of spikes (A2) or membrane voltages (A3). (B) AP amplitude (measured from voltage threshold to AP peak). SHS exposure group had significantly lower AP amplitude when grouped with same injected currents (B1) or total number of spikes (B2) but not with same membrane voltages (B3). (C) AP maximum rise rate. Compared to the FA group, the SHS group had a lower rise rate at the same injected current (C1). There was no difference when grouping data by total number of spikes (C2) or membrane voltages (C3). (D) Three-way repeated measures ANOVA results. CVTS, injected current, membrane voltage, or total spikes. *p < 0.05 SHS vs. FA, †p < 0.05 main effect for membrane voltage.

