Figure 5.
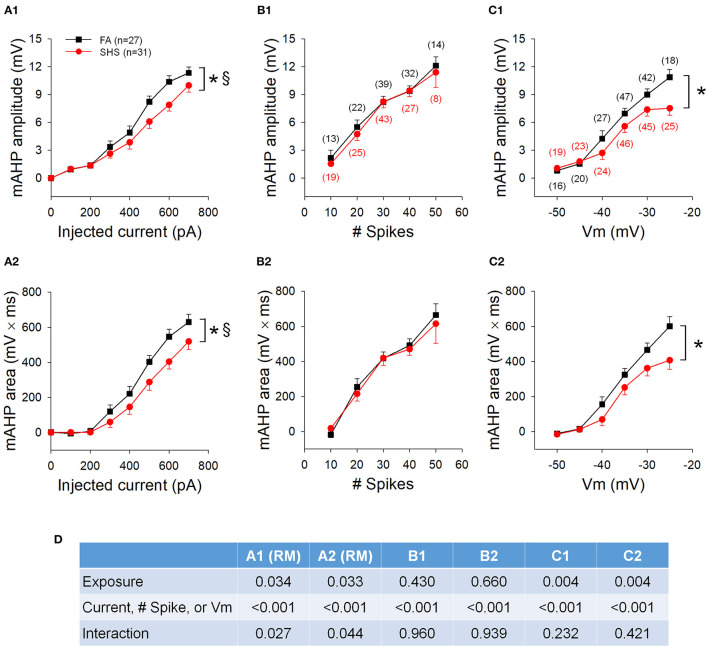
Effects of SHS on mAHP amplitude and mAHP area. (A) mAHP amplitude (A1) and area (A2) at the same injected currents were smaller in the SHS exposed group. (B) mAHP amplitude (B1) and area (B2) plotted against the total number of spikes discharged during the 1 s step current injection. There was no difference between the FA and SHS groups. (C) mAHP plotted against average membrane voltage (Vm) during 1 s step current injections showing smaller mAHP amplitude (C1) and area (C2) in the SHS group. (D) Two-way ANOVA results. RM, repeated measures; Numbers in parentheses indicate number of neurons. *p < 0.05 SHS vs. FA, §p < 0.05 exposure x current interaction.

