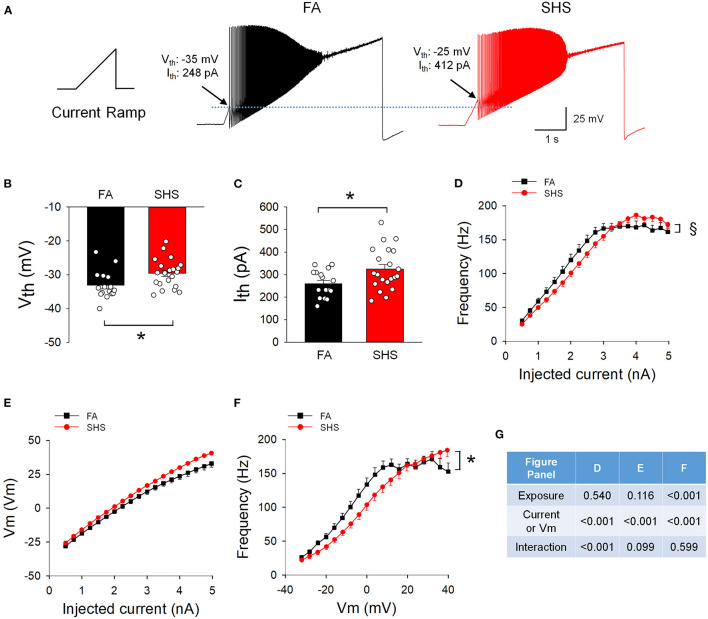
Figure 6.
Effects of SHS on spiking responses to a ramp current injection (5 nA in 5 s). (A) Example traces of neurons from one FA and one SHS exposed group. Arrows indicate the membrane voltage and injected current where the first action potential was discharged and was designated as voltage threshold (Vth) and current threshold (Ith) respectively. (B) Group data of voltage threshold showing a significantly higher threshold for neurons from the SHS group (t-test, p = 0.0166). (C) Group data of current threshold showing that higher input currents were required to evoke an action potential in the SHS group (t-test, p = 0.0141). (D) Instantaneous frequency during the 5-s ramp current injection. The significant exposure by current interaction indicates that the SHS group had a flatter increase in instantaneous frequency as the injected current increased (flatter input-output relationship). (E) Membrane voltage during the ramp current injection showing no difference between FA and SHS, suggesting that the flatter input-output relation to current injection is not due to a smaller membrane voltage response to the injected current. (F) Instantaneous frequency plotted against membrane voltage during the 5-s ramp current injection. The SHS group had lower spiking frequency at the same voltages. (G) Two-way repeated measures ANOVA results for panels (D–F). Sample size: n = 16 for FA and n = 21 for SHS. *p < 0.05 SHS vs. FA, §p < 0.05 exposure x current interaction.

