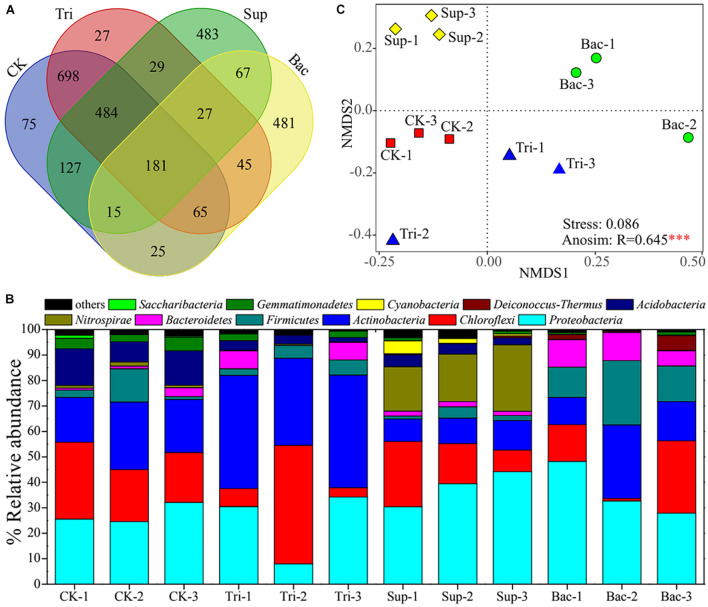
FIGURE 2.
Composition of rhizosphere bacterial community. (A) Venn diagram shows the shared core microbiomes among four groups. (B) Stacking diagram reflects relative abundances of top 11 bacterial phyla (relative abundance > 1%) in 12 soil samples. (C) Non-metric multidimensional scaling plot exhibits difference in bacterial community composition among four treatments. Asterisks denote significance (∗∗∗p < 0.001).

