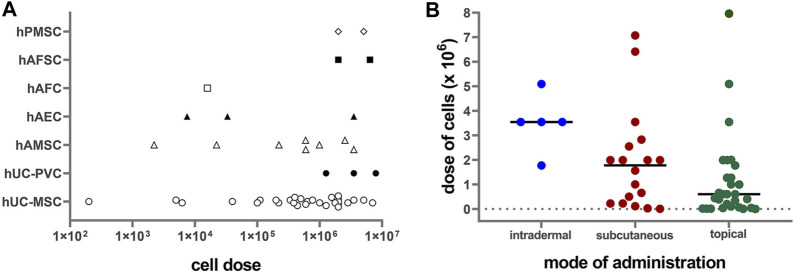
FIGURE 2.
(A) Correlation of applied PnD cell type versus cell number/cm2 on a logarithmic scale (Log10). hUC-MSC, human umbilical cord mesenchymal stromal cells; hAMSC, human amniotic membrane mesenchymal stromal cells; hPMSC, human placenta mesenchymal stromal cells; hAFC, human amniotic fluid cells; hAFSC, human amniotic fluid cells; hUC-PVC, human umbilical cord perivascular cells; hAEC, human amniotic membrane epithelial cells. (B) Correlation of cell doses with the mode of administration. Lines represent median values.

