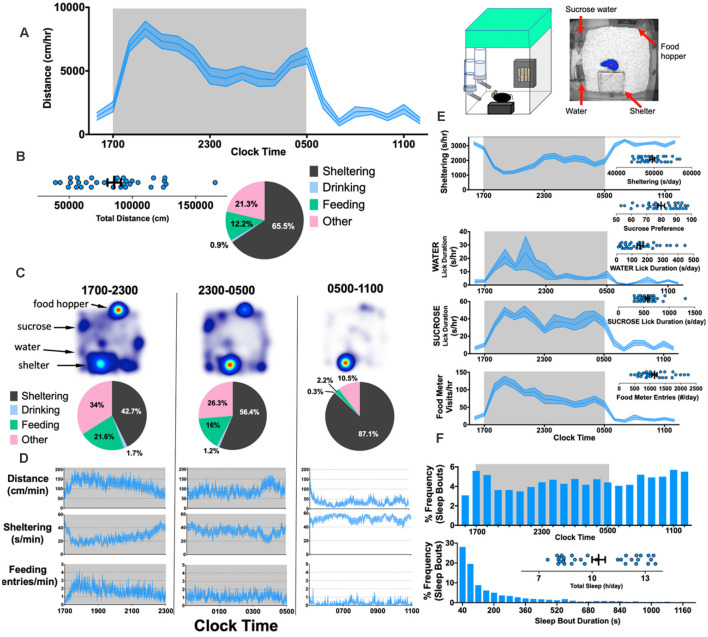
Figure 6.
Simultaneously measuring kinematic and neurovegetative function in PhenoTyper home cages. Right: Cartoon showing home-cage configuration with a screen capture from an aerial infrared camera showing mouse body contour (blue) and center point (red). (A) Horizontal distances accumulated hourly by 8-week old C57BL/6J mice (n = 32, 16 female). (B) Total distances moved (per day), and the mean “time budget” calculated across this 21 h recording period. (C,D) Heat maps, time budgets and behavioral quantities depicted over 6 h long epochs. “Other” is defined as time spent not sheltering, drinking or feeding. (E) Average rates of sheltering, licking and feeding measured simultaneously with individual total values plotted in inset. (F) Percent frequency of (noninvasively derived) sleep bouts as a function of time of day (Top) and by duration of sleep bout (Bottom), with individual values obtained for total sleep (Inset). The mean + SEM is shown. The figure is adapted from Jankovic et al. (2019).

