Figure 8.
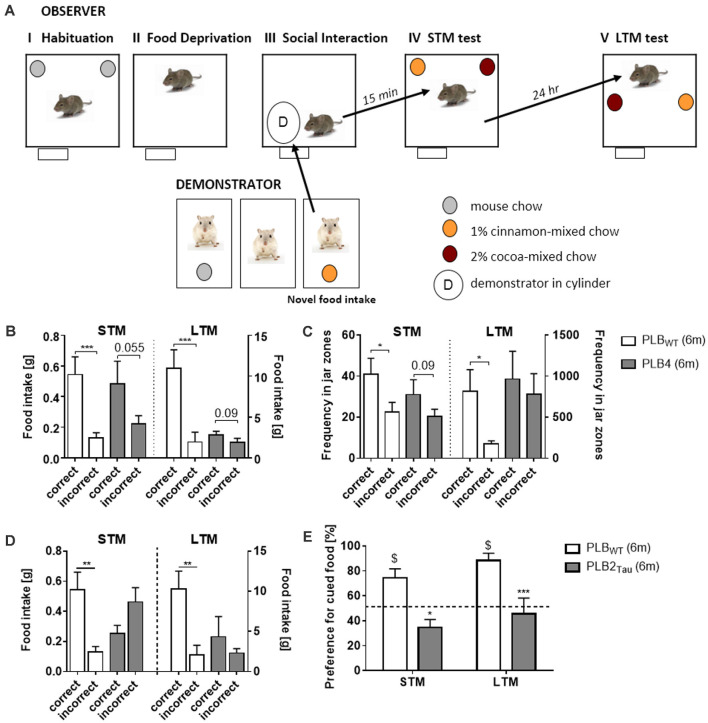
Assessment of semantic-like memory in a home-cage environment via a social transmission of food preference (STFP) task. (A) Outline of a novel semi-automated STFP task developed in the PhenoTyper. The task consists of various phases using “observer” and “demonstrator” animals. Observer animals are initially habituated to the PhenoTyper whilst demonstrator mice are single housed, both animals are habituated to food jars containing mouse chow. Prior to the test all mice are subjected to overnight food restriction after which the demonstrator animals are given a flavored mouse chow (cocoa or cinnamon). The observer animal is subsequently exposed to the demonstrator animal via a cylinder positioned within the PhenoTyper and interaction between the two animals initiated. Social interaction for cued food was followed by either a short (15 min—STM) or long delay (24 h—LTM) prior to the mice being tested for recall via the presentation of jars containing correct and incorrect food. The amount of food consumed, and time spent in the zones associated with each jar were recorded with intact semantic memory represented by a preference for the cued food they were exposed to via the demonstrator. Analysis of correct food eaten, i.e., food matching the flavor of the demonstrator (B), and time spent in food jar zones (C) revealed that 6 month old PLB4 mice (mice with mild overexpression of human BACE1 involved in neurodegeneration) displayed impaired memory for the cued food in both STM and LTM tests, with only PLBWT mice (i.e., mice from PLB crossings that do not carry transgenes) displaying intact memory for the cued food. Impairments in memory for the cued food were also observed with PLB2Tau (i.e., knock-in mice which express a single copy of FTD human Tau) with mice consuming less of the correct food (D) and in contrast to age matched PLBWT mice they demonstrated no preference for the cued food in either STM or LTM tasks (E). The figure is adapted from Plucińska et al. (2014) and Koss et al. (2016). *P < 0.05; **P < 0.01; ***P < 0.001, for group comparisons. $P < 0.05 significance vs. chance (50%).

