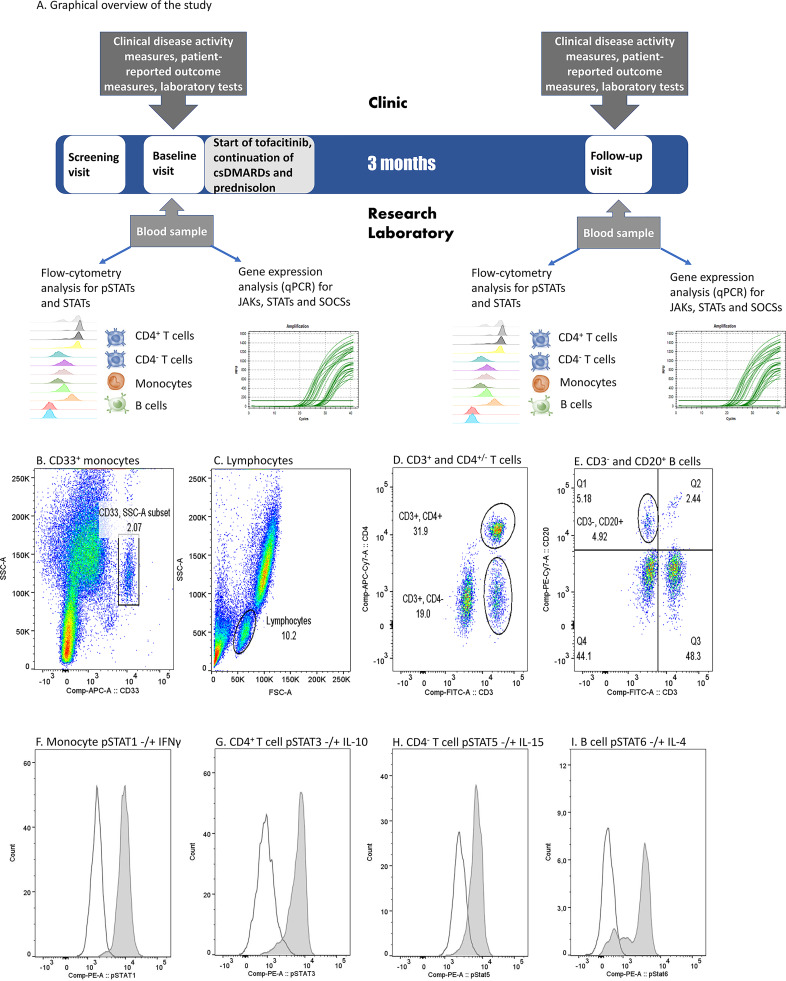
Figure 1.
(A) Graphical overview of the study and (B–I). Flow cytometry gating strategy and examples of cytokine-induced phosphorylated STAT (pSTAT) in each cell population in one patient sample. (B) Monocyte gate was set based on CD33 positivity and light scattering characteristics (SSC-A). (C) Lymphocytes were gated based on light scattering characteristics (FSC-A and SSC-A). (D) Among lymphocytes, T cell gates were set to comprise CD3+CD4+ or CD3+CD4- populations. (E) Among lymphocytes, B cell gate was set to comprise CD3- and CD20+ population. (F) pSTAT1 histograms in unstimulated (open peak) and IFN-γ-stimulated (grey peak) monocytes. (G) pSTAT3 histograms in unstimulated (open peak) and IL-10-stimulated (grey peak) CD4+ T cells. (H) pSTAT5 histograms in unstimulated (open peak) and IL-15-stimulated (grey peak) CD4- T cells. (I) pSTAT6 histograms in unstimulated (open peak) and IL-4 stimulated (grey peak) B cells. IFN, interferon; IL, interleukin, (p)STAT, (phosphorylated) signal transducer and activator of transcription.

