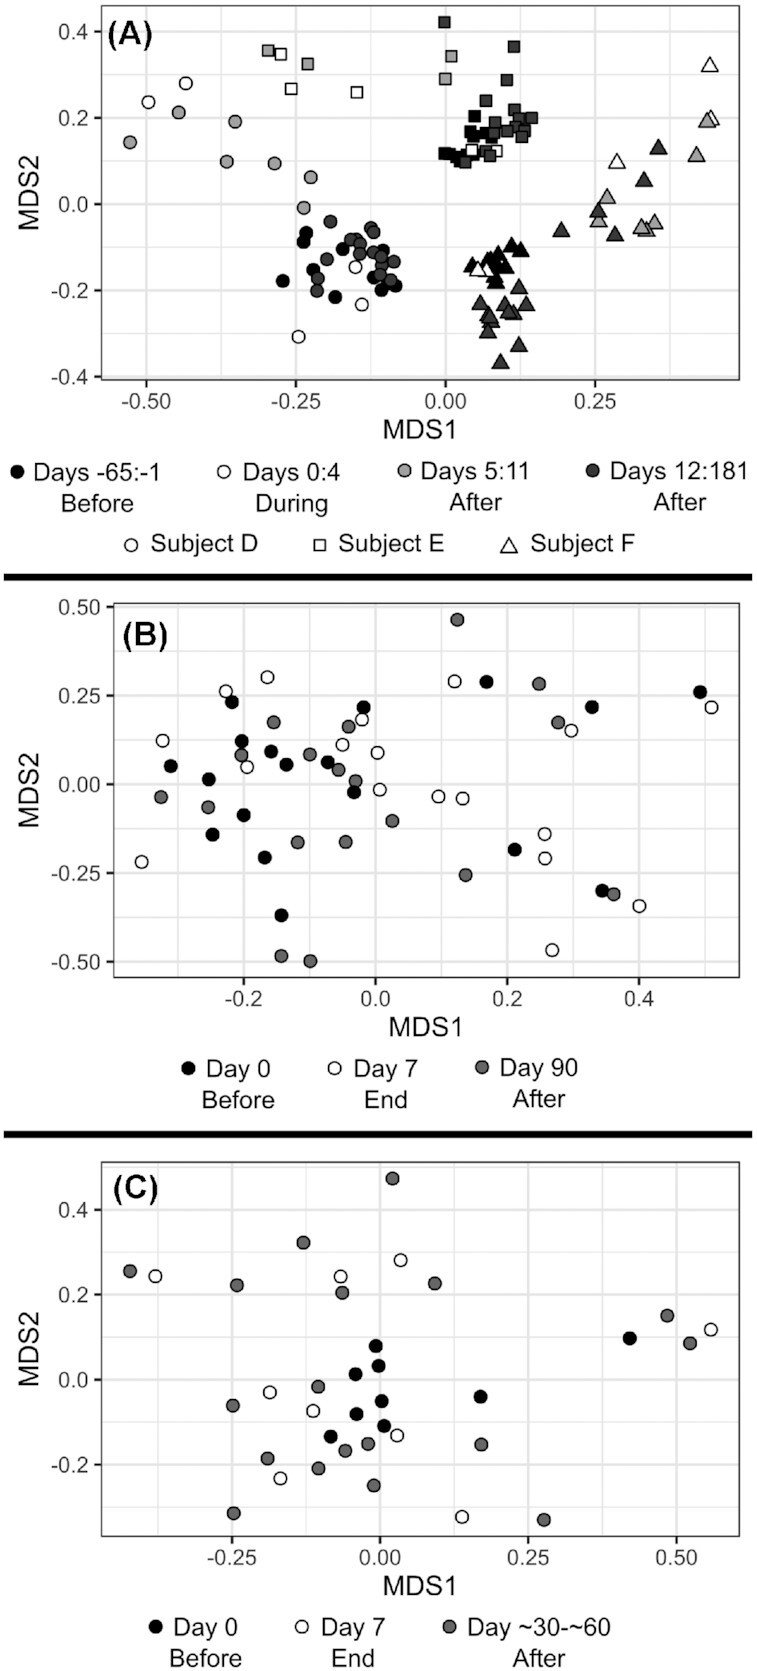
Figure 1.

Example effects of antibiotic treatment on the community composition of the gut microbiota. All graphs show the relationship between samples via non-metric multidimensional scaling of Bray-Curtis dissimilarity. Data for all graphs was processed and visualised using the 'vegan' package and the 'ggplot2' package in the R programming language (Wickham 2016; Oksanen et al.2019; R Core Team 2020). (A) shows data from only the first round of treatment covered by Supplementary Dataset 1 of Dethlefsen & Relman., representing up to 40 samples from each of 3 subjects treated with ciprofloxacin, with a stress of 0.156849 (Dethlefsen and Relman 2011). (B) shows data from only the treated subjects covered by Raymond et al. and taxonomically classified by Supplementary Data 1 of Chng et al., representing 18 subjects treated with cefprozil, and with a stress of 0.2342019 (Raymond et al. 2016; Chng et al. 2020). (C) shows data from only the clindamycin treatments covered by Zaura et al. and taxonomically classified by Supplementary Data 1 of Chng et al., representing 9 subjects, and with a stress of 0.1898547 (Zaura et al. 2015; Chng et al. 2020).
