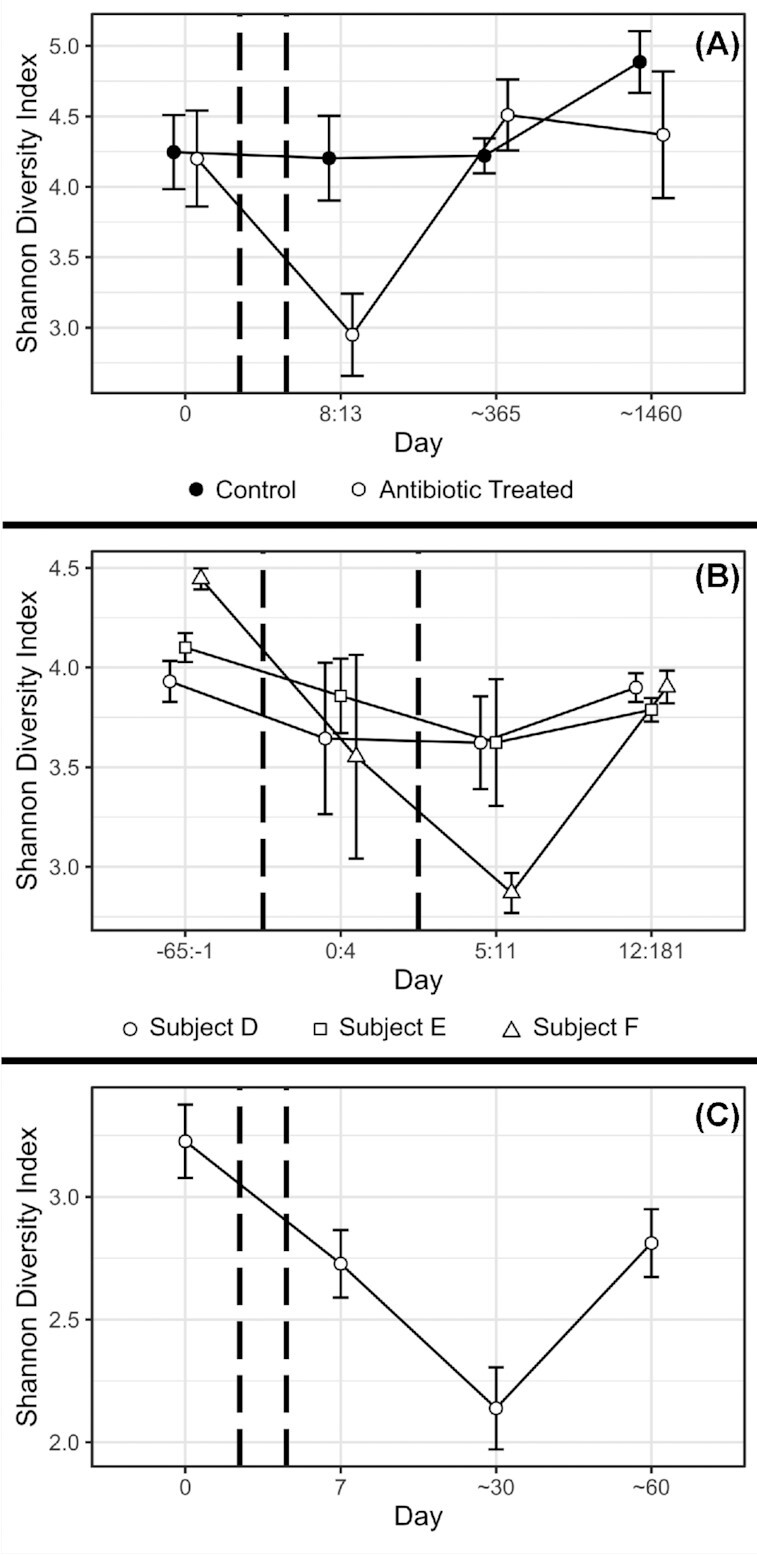
Figure 2.

Example effects of antibiotic treatment on diversity of the gut microbiota. In all graphs, antibiotic treatment took place between pairs of dashed vertical lines, and error bars represent 1 standard error around the mean. Data for all graphs was processed and visualised using the 'vegan' package and the 'ggplot2' package in the R programming language (Wickham 2016; Oksanen et al.2019; R Core Team 2020). (A) Shows data from Table 5 (Supporting Information) of Jakobsson et al., representing three untreated controls and three subjects treated with a combination of two antibiotics (metronidazole and clarithromycin) and a proton pump inhibitor (omeprazole) (Jakobsson et al. 2010). (B) Shows data from only the first round of treatment covered by Supplementary Data set 1 of Dethlefsen & Relman, representing up to 40 samples from each of 3 subjects treated with ciprofloxacin (Dethlefsen and Relman 2011). (C) Shows data from only the clindamycin treatments covered by Zaura et al. and taxonomically classified by Supplementary Data 1 of Chng et al., representing nine subjects (Zaura et al. 2015; Chng et al. 2020).
