
Figure 6.
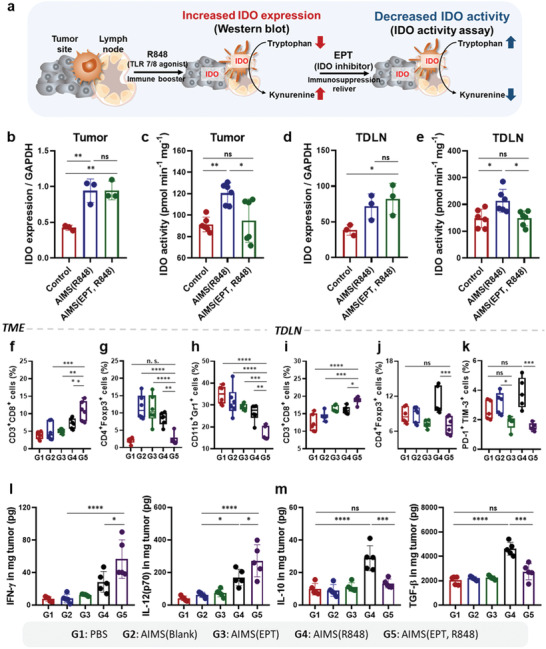
Supra‐adjuvant induced the modulation of immune profile in the TME and TDLN. a) Schematic depiction of IDO expression induced by treatment with AIMS(R848) and subsequent blocking of IDO activity by AIMS(EPT). Mice were treated four times, at 3 d intervals, when the tumors reached 50–60 mm3 in size. Western blot analysis of IDO‐1 expression are quantitatively analyzed with normalization of GAPDH in b) TME and c) TDLN (n = 3). IDO activity in d) TME and e) TDLN was measured by an IDO activity assay (n = 6). Flow cytometry analysis showing the populations of f) CD3+CD8+ T cells, g) CD4+Foxp3+ Treg cells, and h) CD11b+Gr‐1+ MDSCs in the TME (n = 6). Flow cytometry analysis showing the populations of i) CD3+CD8+ T cells, j) CD4+Foxp3+ Treg cells, and k) PD1+TIM‐3+ exhausted T cells in TDLN (n = 6). l) Concentrations of proinflammatory cytokines (IFN‐γ and IL‐12(p70)) in the TME and TDLN (n = 5). m) Concentrations of anti‐inflammatory cytokines (IL‐10 and TGF‐β) in the TME and TDLN (n = 5). Data are presented as the mean ± SD. P values were determined by one‐way ANOVA (*P < 0.05, **P < 0.01, ***P < 0.005, ****P < 0.001; ns, not significant).