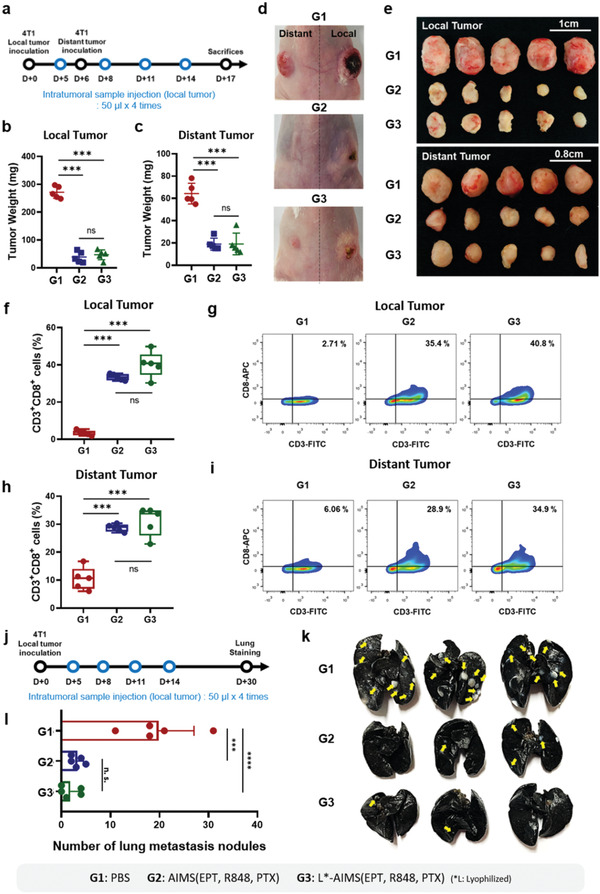
Figure 7.

Generation of a systemic antitumor immune response by AIMS and lyophilized AIMS. a) Treatment schedule in the distant 4T1 tumor‐bearing BALB/c mouse model. The tumor weight of b) local and c) distant tumors (n = 5). Representative photographs of d) mice, and e) detached tumor images of each group (n = 5). f–i) Flow cytometry analysis and corresponding representative data show the population of CD3+CD8+ T cells in f,g) local and h,i) distant tumors (n = 5). j) Treatment schedule for lung metastasis analysis in a 4T1 tumor‐bearing BALB/c mouse model. k) Lung photograph showing metastatic tumors from mice 30 d after tumor inoculation (yellow arrow; tumors in the lung) and i) corresponding quantification of the number of metastatic lung nodules (n = 5). Data are presented as the mean ± SD. P values were determined by one‐way ANOVA (***P < 0.005, ****P < 0.001; ns, not significant).
