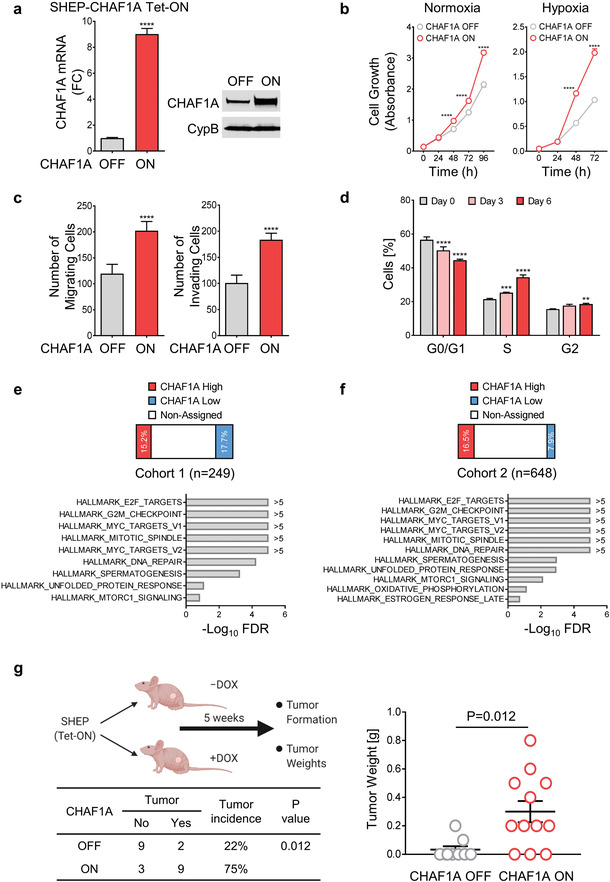
Figure 1.

CHAF1A promotes NB aggressiveness. a) CHAF1A is turned on upon DOX induction (1 µg mL−1 for 72 h) in SHEP cells. Validation of CHAF1A overexpression by qPCR and western blotting is shown. Date are mean ± SD (n = 3); ****p < 0.0001; two‐sided unpaired t‐test. b) Proliferation assay in SHEP‐CHAF1A cells. Cells were cultured in normoxic and hypoxic (1% O2) conditions for 0–96 h. Cell number was assessed by Cell Counting Kit‐8 and are indicated by absorbance (450 nm). Mean ± SD (n = 4); ****p < 0.0001; two‐way ANOVA with Sidak's multiple comparisons test. c) Migration and invasion analyses of SHEP‐CHAF1A cells upon induction of CHAF1A (48 and 72 h). Mean ± SD (n = 5–10); ****p < 0.0001; two‐sided unpaired t‐test. d) Cell cycle analysis of SHEP‐CHAF1A cells upon induction of CHAF1A (3 and 6 days). Mean ± SD (n = 4); **p < 0.01, ***p < 0.001, ****p < 0.0001; two‐way ANOVA with Dunnett's multiple comparisons test. e,f) GSEA Hallmark analysis in patients with high and low CHAF1A expression in two independent patient cohorts. False discovery rate (FDR) is computed using a Benjamini–Hochberg corrected two‐sided homoscedastic t‐test. Pathways are ranked by −Log10 FDR (FDR < 0.25). g) Tumor formation upon activation of CHAF1A in an orthotopic mouse model. Low‐tumorigenic NB SHEP cells were injected into the renal capsule of NCr nude mice. Four‐week‐old mice were treated with control (n = 11) or DOX‐containing diet (0.625 g kg−1, n = 12) for five weeks. Tumor incidence and tumor weights are shown. Data are the mean ± SEM; comparison of tumor incidence between CHAF1A OFF and CHAF1A ON mice was computed by two‐sided Fisher's exact test, p = 0.012.
