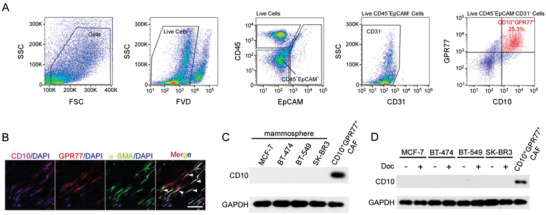
Figure 1.

CD10 expression in CAFs. A) Representative flow cytometry plot of gating strategy to identify the CD10+GPR77+ CAF subset in breast cancer clinical samples. B) Representative images of CD10, GPR77, and α‐SMA immunofluorescence staining in human breast cancer sections. White arrows indicate CD10+GPR77+ CAFs. Scale bar, 50 µm. C) CD10 levels in indicated mammospheres and CD10+GPR77+ CAFs (n = 3). D) CD10 levels in indicated tumor cells treated with docetaxel and CD10+GPR77+ CAFs (n = 3).
