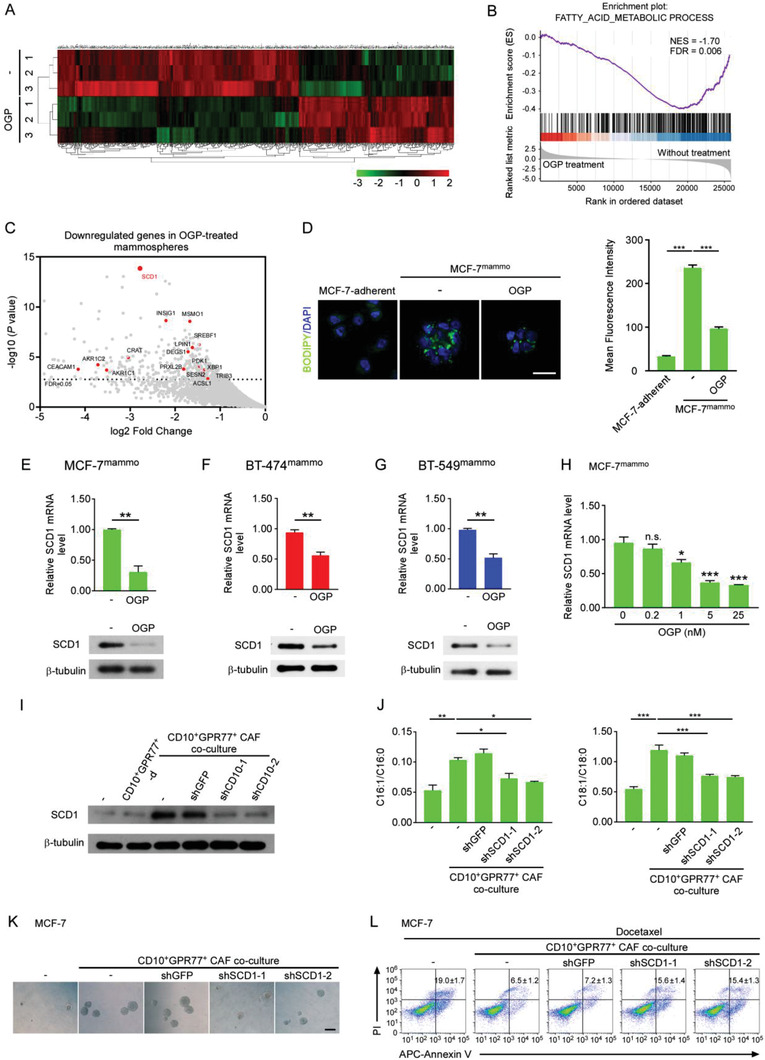
Figure 6.

OGP suppresses CSCs by inhibiting lipid desaturation. A–C) MCF‐7mammo cells were treated with or without 5 × 10⁻⁹ m OGP (n = 3). A) Heatmaps representing differentially expressed genes (fold change > 2, P < 0.05). B) Gene set enrichment analysis (GSEA)‐based analysis revealed a significant enrichment of the fatty acid metabolism‐related gene set in downregulated mRNAs after OGP treatment. C) Volcano plot showing downregulated genes in MCF‐7mammo cells treated with OGP. Red dots represent top genes (log2 fold change > 2 and FDR < 0.05, compared to the control group) that were enriched in fatty acid metabolic process. The dashed line indicates an FDR of 0.05. D) Representative immunofluorescent images (left) and quantification (right) of BODIPY staining in MCF‐7 cells and MCF‐7mammo cells treated with or without OGP. Scale bar, 20 µm. The quantification was made by calculating the fluorescence intensity of BODIPY in 6 randomly selected regions of interest for each sample. Mean ± SEM, n = 3. ***P < 0.001 by one‐way ANOVA. E‐G Levels of SCD1 in E) MCF‐7mammo, F) BT‐474mamm, and G) BT‐549mammo cells treated with OGP were detected by qRT‐PCR (upper panel) and western blotting (lower panel) (mean ± SEM, n = 3). **P < 0.01 by Student's t‐test. H) The expression of SCD1 in MCF‐7mammo cells treated with or without OGP at the indicated concentrations was determined by qRT‐PCR. Mean ± SEM, n = 3. N.s., not significant; *P < 0.05; ***P < 0.001 by one‐way ANOVA. I) Western blotting of SCD1 levels in MCF‐7 cells after coculture with CD10+GPR77+‐d CAFs or CD10+GPR77+ CAFs with CD10 knockdown (n = 3). J–L) MCF‐7 cells transduced with SCD1 shRNAs were cocultured with CD10+GPR77+ CAFs. J) Ratio of monounsaturated fatty acid to saturated fatty acid (C16:1/C16:0, C18:1/C18:0) in MCF‐7 cells determined by GC‐MS (mean ± SEM, n = 3). *P < 0.05; **P < 0.01; ***P < 0.001 by one‐way ANOVA. K) Representative images of mammosphere formation in MCF‐7 cells Scale bar, 100 µm. L) Representative flow cytometry plots indicate docetaxel‐induced apoptosis in MCF‐7 cells. Numerical values are presented as Annexin V+ percentage (mean ± SEM, n = 3).
