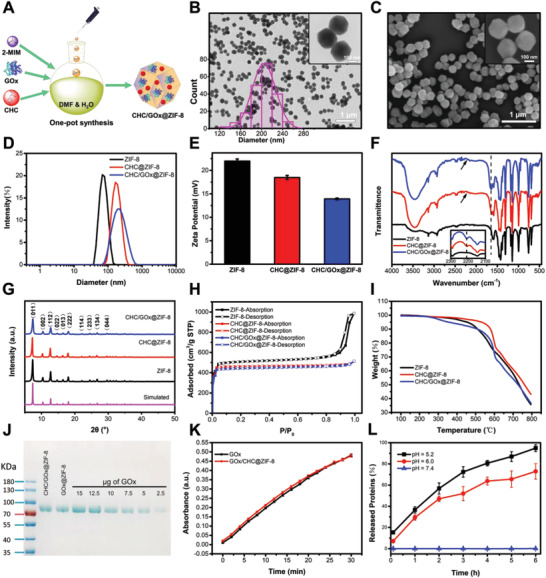
Figure 3.

Synthesis and characterization of CHC/GOx@ZIF‐8 crystals. A) Illustration of the one‐pot synthesis of CHC/GOx@ZIF‐8. B) TEM images with size distribution and C) SEM images of CHC/GOx@ZIF‐8 crystals. D) Hydrodynamic size distribution, E) zeta potential, F) FT‐IR absorption spectra, G) PXRD, H) BET, and I) TGA absorption spectra of ZIF‐8, CHC@ZIF‐8, and CHC/GOx@ZIF‐8. J) SDS‐PAGE analysis of GOx loading efficiency in GOx@ZIF‐8 and CHC/GOx@ZIF‐8. K) Kinetics of TMB oxidation catalyzed by free GOx and GOx released from CHC/GOx@ZIF‐8. L) The pH‐dependent release profile of CHC/GOx@ZIF‐8. Scale bar in Figure 3B,C: 1 µm. Scale bar in the inserts of Figure 3B,C: 100 nm.
