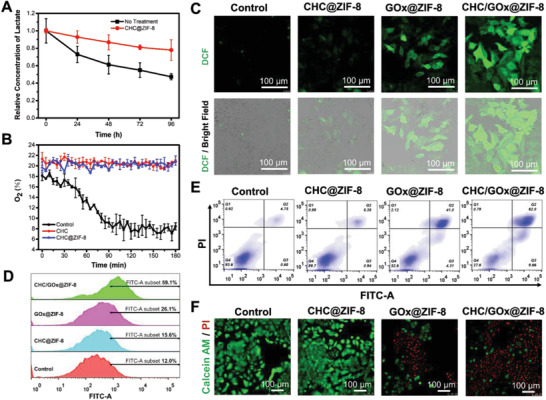
Figure 5.

A) Lactate and B) O2 consumption profile of cells after different treatment. C) LSCM images and D) FCM analysis of cells stained with DCFH‐DA after incubation with CHC@ZIF‐8, GOx@ZIF‐8, and CHC/GOx@ZIF‐8 for 6 h. E) FCM analysis of cellular apoptosis and F) LSCM images of live/dead cells stained with calcein‐AM (green)/PI (red) after incubation with CHC@ZIF‐8, GOx@ZIF‐8, and CHC/GOx@ZIF‐8 for 24 h. Cell culturing media for this part are DMEM with 10% FBS, glucose (10 mm), and lactate (10 mm). Scale bar in Figure 5C,F: 100 µm.
