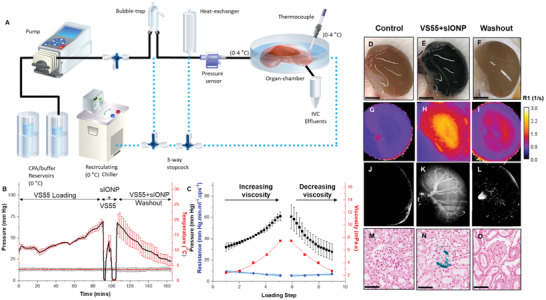
Figure 2.

Hypothermic perfusion loading and unloading of rat kidneys with VS55+sIONPs. A) Schematic layout of the hypothermic perfusion circuit. The cold CPA (0–4 °C) is perfused using a peristaltic pump through a bubble trap and a heat exchanger before entry into the renal artery. Pressure and temperature sensors record the arterial pressure and chamber temperature, respectively, throughout the experiment. A circulating chiller is used to cool the bubble trap, heat exchanger, and organ chamber. B) Mean arterial pressure and chamber temperature variation over time during hypothermic perfusion loading and unloading of a rat kidney with VS55 and sIONPs. Error bars indicate the standard error (SEM) for n = 4 rat kidneys. The loading steps were Euro Collins (EC), 18.75%, 25%, 50%, 75%, and 100% v/v (8.4 m) VS55 and the wash out steps were 75%, 50%, 25% VS55 (v/v), and EC (Table S2, Supporting Information); no osmotic buffering was used during washout. C) Variation of peak pressure over the loading and unloading steps correlates with increase and decrease in viscosity of the perfusate, as VS55 concentration is increased during loading and decreased during washout. At each loading step, there is an overall increase in pressure due to the increase in viscosity overlapping with a transient reduction in pressure due to the vascular osmotic response to the increased concentration (osmotic vasodilation—Figure 2B; Figure S2, Supporting Information); As a net result, calculated resistance, R (blue points) actually decreases as viscosity increases; shaded blue region indicates 95% confidence interval of a linear fit of R versus time (loading steps). R is only calculated for VS55 loading and washout, not during sIONP loading. D–F) Gross images of a control, VS55+sIONP loaded and washed‐out kidney, respectively. Scale bar is 0.5 cm. G–I) MR images depicting the distribution of sIONPs, as based on the water relaxation rate constant (R1), of a control, VS55+sIONP loaded and washed‐out kidney, respectively. J–L) X‐ray µCT images of a control, VS55+sIONP loaded and washed‐out kidney, respectively, showing spatial resolution of sIONPs in the kidney vasculature. M–O) Prussian blue staining, to show Fe deposition in a control, VS55+sIONP loaded and washed‐out kidney, respectively. Fe localization is seen in the glomeruli of VS55+sIONP loaded kidneys. Washed out kidneys show clear glomeruli. Scale bar is 150 µm for histology images.
