Figure 3.

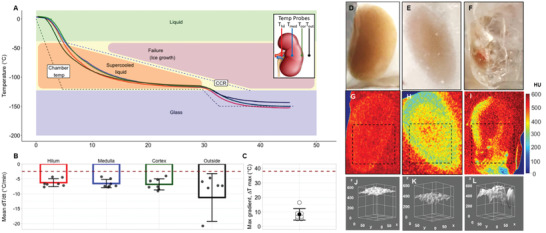
Vitrification success and failure in VS55 loaded kidneys. A) Temperature versus time (T vs t) plot during cooling of a kidney for vitrification. Cooling was performed in a bag‐setup (Methods, Figure S6, Supporting Information) in a controlled rate freezer (CRF). As shown in the inset, fiber optic temperature probes were placed in the hilum, medulla, cortex and outside the kidney (inside the bag) to measure temperature distribution during cooling. B) Mean, SEM, and scatter plot of cooling rates measured at each probe location, for n = 7 kidneys, relative to CCR of VS55 (dotted line). Mean cooling rates at all probe locations were faster than the CCR for VS55, suggesting no ice crystallization. C) Mean, SEM, and scatter plot of maximum gradient ∆T in the glassy state for n = 7 kidneys. These are well below the dotted line indicating the maximum stress‐to‐fracture threshold of ∆T max (38 °C) for VS55. D–F) Gross images of a vitrified, frozen, and a cracked kidney, respectively. G–I) X‐ray µCT of a vitrified, frozen and cracked kidney, respectively. X‐ray attenuation differences between cases, expressed in Hounsfield Units (HU), are used to detect amorphous (vitrified) versus frozen regions in the kidney and abrupt/sharp X‐ray attenuation changes, indicating cracks. J–L) 3D surface histogram plots for dotted square regions in Figure 3G–I, respectively, indicate spatial X‐ray attenuation differences in vitrified, frozen, and cracked kidneys, within a given plane.
