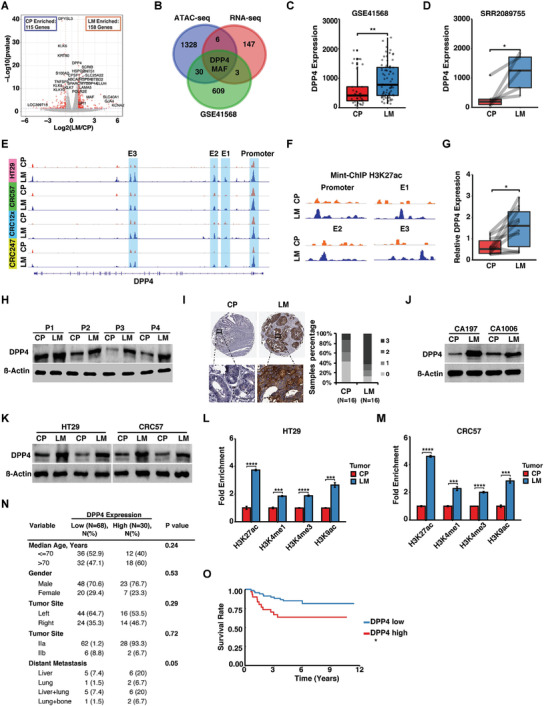
Figure 2.

DPP4 is upregulated in CRC liver metastases. A) RNA‐seq volcano‐plot showing DE genes detected in HT29 liver metastases versus primary CRC tumor. B) Integrated analysis of ATAC‐seq, RNA‐seq, and GEO dataset (GSE41568) of upregulated genes in liver metastases. C) Analysis of differential DPP4 expression in GEO dataset (GSE41568) between primary CRC and liver metastases. D) Analysis of differential DPP4 expression in the clinical RNA‐seq dataset SRR2089755 from five matched patient liver metastases versus primary CRC tumor. E) ATAC‐seq signal track showing DPP4‐associated open chromatin in liver metastases versus primary CRC tumor. F) Mint‐ChIP signal track showing H3K27ac histone activation markers in the DPP4 promoter and three enhancers in liver metastases versus primary CRC. G) RT‐qPCR showing DPP4 expression levels in patient liver metastases versus primary CRC tumors. H) Western blots showing DPP4 expression levels in paired primary CRC and liver metastases collected from four patients. I) Representative IHC staining and evaluation of DPP4 expression measured on a tissue microarray that contains 16 paired primary CRC and liver metastases. (Scale bar, 50 um). J) Western blots showing DPP4 expression levels in two paired patient‐derived liver metastases and primary CRC organoids. K) Western blots showing DPP4 expression levels in primary CRC and liver metastases derived from cecum‐injected‐HT29 and ‐CRC57 cells. L,M) ChIP‐qPCR analysis showing changes in H3K27ac, H3K4me1, H3K4me3, and H3K9ac levels on DPP4 promoter in liver metastases versus primary CRC tumor. N) Correlation of DPP4 expression and clinicopathological features of 98 CRC patients. O) Kapla–Meier analysis of relapses of CRC patients with high (N = 30) and low (N = 68) DPP4 expression levels in the tumors. LM, liver metastases. CP, CRC primary tumor. E1, E2, and E3, enhancer 1, enhancer 2, and enhancer 3. Data represent the mean ± s.e.m. in (C) and (D), and mean ± s.d. in (G), (L), and (M). p‐values were calculated based on Student's t‐test in (C), (D), (G), (L), (M), and (N), and log‐rank test in (O). *p < 0.05; **p < 0.01; ***p < 0.001; ****p < 0.0001.
