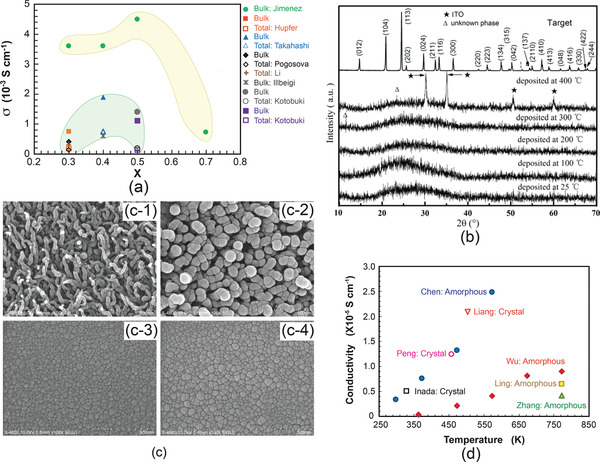
Figure 13.

a) Influence of Li concentration of Li1+ x Al x Ti2‐ x (PO4)3 showing the trend of increase in ionic conductivity with increase in Li concentration (Jimenez,[ 135 ] Hupfer,[ 136 ] Takahashi,[ 137 ] Pogosova,[ 138 ] Li,[ 74 ] Illbeigi,[ 139 ] Kotobuki[ 140 ]), b) structural evolution of Li1.3Al0.3Ti1.7(PO4)3 films which were deposited using an rf‐PVD at different substrate temperatures, c) morphologies of the LATP thin films deposited at different temperatures: c‐1) 25 °C, c‐2) 100 °C, c‐3) 200 °C and c‐4) 300 °C. b,c) Reproduced withpermission.[ 141 ] Copyright2011, Elsevier. d) Ionic conductivities of NASICON‐structured amorphous thin film electrolytes deposited at different temperatures (Chen (Li1.3Al0.3Ti1.7(PO4)3; rf‐sputtering),[ 141 ] Wu (Li‐Ti‐Si‐P‐O‐N; rf‐sputtering),[ 142 ] Ling (Li1.3Al0.3Ti1.7(PO4)3; rf‐sputtering),[ 143 ] Zhang (Li1.4Si0.4Ti1.6(PO4)3; rf‐sputtering),[ 144 ] Peng (Li1.3Al0.3Ti1.7(PO4)3; hydrothermal),[ 145 ] Liang (Li1‐ x Ti2‐ x Ga x (PO4)3; hydrothermal),[ 146 ] Inada (Li1.5Al0.5GE1.5(PO4)3; aerosol)[ 324 ]).
